


Perfusion- and Diffusion-Weighted Imaging: Can Novel MR Techniques Aid Management of Acute Cerebral Ischemia?
Authors
Kirsten P.N. Forbes, MD, FRCR
Shahram Partovi, MD
Joseph E. Heiserman, MD, PhD
Division of Neuroradiology, Barrow Neurological Institute, St. Joseph’s Hospital and Medical Center, Phoenix, Arizona
Abstract
A new treatment option for acute cerebral ischemia, intravenous thrombolysis with recombinant tissue plasminogen activator, has been approved by the Food and Drug Administration, while other potential therapies remain under development. To be effective, thrombolysis must be administered within 3 hours of symptom onset. Candidates for treatment therefore must be identified and diagnosed quickly. Two new magnetic resonance imaging techniques—perfusion- and diffusion-weighted imaging—are now available for this purpose. Used together within an appropriate window of time, these two techniques can identify whether patients with hyperacute ischemia have salvageable tissue.
Key Words: cerebral ischemia, diffusion-weighted imaging, magnetic resonance imaging, perfusion-weighted imaging, thrombolysis
The availability of effective treatment for acute cerebral ischemia brings new imaging challenges. This article discusses perfusion and diffusion-weighted imaging, two novel magnetic resonance (MR) techniques that may help improve the clinical management of hyperacute stroke. An imaging study that incorporates these techniques is both feasible during the therapeutic window for thrombolysis and highly informative. While perfusion imaging detects cerebral hypo perfusion, diffusion-weighted imaging assesses whether hypoperfusion has led to a change in cellular function, indicating imminent cell death. Together, they can identify the presence of a potentially salvageable ischemic penumbra, the target for thrombolysis. This review discusses perfusion-and diffusion-weighted imaging, examining the technical bases of both, previous studies of their use in acute cerebral ischemia, and their potential use in the imaging of hyperacute cerebral infarction.
Treatment Options for Acute Cerebral Ischemia
The publication of the National Institute of Neurological Disorders and Stroke (NINDS) study in 199528 greatly influenced the management of hyperacute cerebral ischemia (Table 1). The results of this study demonstrated a reduction in disability at 3 months in patients treated with intravenous recombinant tissue plasminogen activator (rt-PA) within 3 hours of symptom onset. Based on this finding, the Food and Drug Administration (FDA) licensed the use of intravenous rt-PA during this therapeutic window. Administration of intravenous thrombolysis later than 3 hours has not proven beneficial and may actually be detrimental due to the risk of intra cerebral hemorrhage.[8] Another drug that has proven beneficial during the first 3 hours of symptoms is ancrod. Preliminary results from the Stroke Treatment with Ancrod Trial (STAT) suggest a beneficial outcome in patients receiving this drug, which acts by reducing blood fibrinogen.[23] Further developments are awaited with interest.
Only one treatment has proven bene ficial when given beyond 3 hours after ictus, intra-arterial pro-urokinase.6 The Prolyse in Acute Cerebral Thromboembolism (PROACT) investigators administered local thrombolysis to subjects with occlusions of the first or second branches of the middle cerebral artery (MCA) within 6 hours of symptom onset. Although this treatment improved arterial recanalization, the effects did not warrant FDA approval.
Attention is now turning to the possibility of combining intravenous and intra-arterial thrombolysis for treatment of hyperacute cerebral ischemia. All eligible subjects would receive intravenous rt-PA at presentation with further local intra-arterial treatment if proximal arterial occlusion were confirmed angiographically. The Emergency Management of Stroke (EMS) Bridging Trial recently published data suggesting that not only is this approach feasible within 3 hours of ictus, but that it leads to improved arterial recanalization.[13] The clinical benefits of this regime, however, remain to be proven.
Selection of Patients for Treatment
The NINDS study demonstrated a beneficial outcome in a selected group of subjects treated with intravenous thrombolysis but did not imply that the outcome for any one individual was necessarily favorable. This situation reflects the increased risk of potentially fatal cerebral hemorrhage in subjects with acute cerebral ischemia after the administration of intravenous thrombolysis.[28] This risk increases further if treatment is given beyond 3 hours after symptom onset.[8] Clinical results would improve if patients most likely to benefit from or be harmed by thrombolysis administered during the current treatment window could be predicted. Prediction of outcome using current clinical measures has been largely unsuccessful. The investigators in NINDS examined a variety of demographic variables, including age, sex, race, and medical history, but failed to find any significant predictors of the outcome of thrombolysis.[26]
Can imaging predict those stroke patients who will benefit from acute thrombolysis? A successful imaging technique would need to be highly sensitive to hyperacute severe cerebral ischemia or at least able to detect ischemia in a subgroup of subjects for whom thrombolysis significantly altered outcome. The most obvious modality to consider is computed tomography (CT) of the brain. This technique is routinely performed in acute stroke patients to exclude intracranial hemorrhage and is highly sensitive for this purpose. Nonetheless, only 40% of subjects with hyperacute cerebral infarction show acute changes on CT when the study is performed within 6 hours of ischemic symptoms.4 In the European Cooperative Acute Stroke Study (ECASS), these early changes associated with infarction predicted the outcome of thrombolysis when CT was performed within 6 hours of ictus.[31] Investigators demonstrated that either a normal CT or infarction involving more than 33% of the MCA territory was associated with an increased risk of fatal intra cerebral hemorrhage. In contrast, CT performed during the first 3 hours of symptoms in NINDS did not predict the outcome of thrombolysis.[26] The ECASS results indicate that imaging may be useful in predicting the outcome of thrombolysis and suggests that a more sensitive technique for detecting hyperacute infarction might be useful in the current 3-hour treatment window.
Cerebral infarction can also be shown on MR imaging. The signal changes associated with tissue edema, however, are seldom found before 8 hours on T2-weighted images or before 16 hours on T1-weighted images.[36] Conventional MR sequences may be able to detect flow-related abnormalities within minutes of cerebral ischemia, but such changes are not reliably seen.[36] No studies have yet evaluated the value of conventional MR findings in predicting the outcome of thrombolysis.
New MR Techniques for Imaging Cerebral Ischemia
Recent advances in MR imaging have led to the development of several new promising techniques that can detect the functional changes associated with acute cerebral ischemia within the brain parenchyma and cerebral vasculature (Table 2). Both CT and conventional MR imaging detect relatively late structural changes from cerebral ischemia, whereas functional techniques can detect changes much earlier. Arterial occlusion can now be confirmed using noninvasive angiographic methods, such as MR angiography or CT angiography.
Although only MR imaging falls within the scope of this article, hemodynamic changes resulting from cerebral arterial occlusion can be assessed with techniques such as MR or CT perfusion or positron emission tomography (PET). Perfusion imaging can detect cerebral hypoperfusion, thereby allowing detection of both potentially reversible ischemia and irreversible cellular damage. Diffusion-weighted imaging can detect the effects of severe or prolonged hypo perfusion on cellular function. This technique detects changes in water compartmentalization associated with cell membrane dysfunction and allows quantification of severely ischemic, likely irreversibly damaged tissue.
Figure 1. Diagram showing the magnetic resonance (MR) signal changes in a single voxel during a gadolinium bolus perfusion study of the brain. The change in MR signal is shown on the vertical axis, with the time from intravenous injection shown on the horizontal axis. The MR signal begins to decrease at 25 to 30 seconds, reflecting the time taken for the contrast to travel from the peripheral vein to the cerebral capillaries. The signal continues to decrease as the bolus passes through local capillaries, reaching a nadir at approximately 55 seconds. The contrast is then removed by the venous system and signal intensity returns toward normal.
Perfusion Imaging
Cerebral ischemic symptoms occur when blood flow drops below the level required for normal neuronal functioning. Normal cerebral function can be restored either naturally or with medical intervention if hypoperfusion is relatively brief and mild. The effects of arterial hypoperfusion on the brain parenchyma depend not only on the degree of proximal vascular occlusion but also on the presence of collateral vessels. Such vessels are very important in maintaining tissue perfusion during major vessel occlusion and play an important role in preserving tissue viability during cerebral is ischemia.
In contrast to MR angiography, which detects blood flow in large and medium-sized vessels, perfusion imaging measures flow in the distal capillary system. Although distal hypo perfusion can be implied from the proximal vascular occlusion demonstrated on angiography, collateral flow cannot be assessed accurately with this technique. MR perfusion imaging detects flow arising from both the proximal artery and collateral vessels, providing an accurate assessment of tissue oxygen and nutrient supply.
This novel form of MR imaging can define the rate at which a volume of blood is delivered to a unit mass of tissue. A small quantity of blood is first labeled using either intravenous contrast or a magnetic tag. As the labeled blood passes through the brain, repetitive MR sequences are performed every few seconds. The temporal effects of the labeled blood on multiple small volumes of tissue, or voxels, can then be assessed. This technique requires the use of ultra-fast MR sequences, such as echo-planar imaging, to perform rapid and repetitive imaging.
Gadolinium Bolus Perfusion Imaging
Currently, gadolinium bolus perfusion imaging is the most widely used MR method for detecting perfusion of the brain parenchyma.[30] This technique documents the relative perfusion of different brain areas and has proven particularly sensitive to changes in focal perfusion. Both hypoperfusion resulting from arterial thromboembolism and hyperperfusion from revascularization can be detected, introducing the interesting possibility of this technique being used not only to detect ischemia but also to monitor treatment outcome.
Technique. Perfusion imaging uses the intravenous contrast agent gadolinium to assess tissue perfusion (Fig. 1). Contrast is administered as a rapid bolus into a peripheral vein and arrives at the cerebral capillaries about 20 seconds after injection, the exact time depending both on the patient’s cardiac output and cerebral blood flow (CBF). A rapid MR sequence (T2*-weighted gradient-echo echo-planar sequence) is repeated every few seconds as the bolus of contrast passes through the cerebral vasculature, allowing the first-pass effects of the contrast on the parenchyma to be observed.
Gadolinium is commonly used in other forms of MR imaging, but its use in perfusion imaging is unique. Most contrast-enhanced imaging is performed with T1-weighted imaging, using the T1-shortening effects of gadolinium. Perfusion imaging, however, is performed with T2*-weighted imaging. Unlike MR angiography, which detects intravascular contrast, or T1-weighted parenchymal imaging, which documents leakage of contrast from the blood-brain barrier (BBB), perfusion imaging detects the local effects of intravascular contrast on the surrounding tissue. The contrast remains confined to the capillaries, but its paramagnetic effect causes inhomogeneity of the local magnetic field. As a result, signal from tissue immediately surrounding the vessel decreases. Integrity of the BBB is important because leakage of gadolinium into the tissues can prolong this effect. The decrease in signal depends both on the vascular concentration of contrast and the concentration of small vessels within the imaged area.[3]
Perfusion Variables. From the drop in MR signal observed during a contrast perfusion study, it is possible to calculate the changing concentration of gadolinium within a voxel (proportional to 1/T2*). This knowledge can be used to calculate a number of physi ological variables of interest using tracer kinetic theory. The most commonly used variable in gadolinium perfusion imaging is the relative mean cerebral blood volume (rCBV). This value is calculated easily from a graph of gadolinium concentration as a function of time, as the area under the curve. Other variables that can be calculated include the time from injection to peak signal drop (time to peak, TTP) and the time for contrast to pass through a voxel (relative mean transit time, rMTT).[3] These nonquantative variables cannot provide absolute measures of blood flow, like xenon or perfusion CT. A separate measure of blood velocity is required to obtain an accurate measurement of CBF. Several techniques have been suggested,[19] but whether the information gained from CBF will be superior to rCBV is uncertain.
Imaging Cerebral Ischemia. Focal hypoperfusion from arterial thrombo embolism decreases both CBV and CBF and increases mean transit time. It remains unclear which of these variables will prove most useful in clinical practice. Early results have suggested that a low rCBV may most accurately predict eventual infarct volume, while infarct growth may be best demonstrated by the difference between low CBF on perfusion imaging and diffusion restriction on diffusion-weighted imaging.[24]

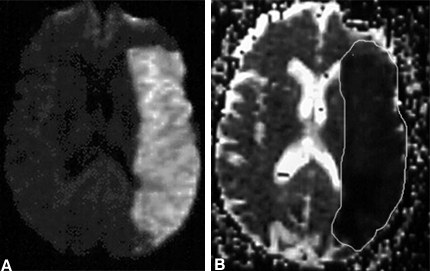
Data from each perfusion variable are easily viewed on a “map” on which values in different voxels can be compared and areas of relative perfusion change identified (Fig. 2). When compared to PET and Xenon-CT,[9,21] perfusion imaging is a highly sensitive technique for detecting cerebral hypoperfusion. Attempts to define a perfusion threshold at which ischemic tissue becomes irreversible, however, have been largely unsuccessful despite evidence from animal studies that such a threshold may exist.[10]
In addition to defining an area of hypoperfusion, perfusion imaging may also help define whether reperfusion, either spontaneous or after thrombolysis, has occurred. Both rCBV and CBF increase to normal or elevated levels with reperfusion,[16] reflecting restoration of blood flow. Perfusion imaging may be able to monitor treatment outcomes, assessing whether reperfusion has occurred in response to thrombolysis.
Arterial Spin Labeling Perfusion Imaging
Instead of administering exogenous contrast to label flowing blood, arterial spin labeling labels blood protons with a magnetic tag. This technique has the advantages of being both completely noninvasive and able to obtain quantitative measures of CBF directly.
Technique. This technique applies a short-lasting magnetic tag to flowing blood just before it enters the brain.[33] An inversion recovery pulse causes protons to be flipped 180º out of phase with protons within the brain par enchyma. As tagged blood flows into the brain, its change in orientation allows it to be identified from protons within the brain parenchyma. Multiple repetitive images of the brain both with and without application of the magnetic tag are obtained to allow signal from the background tissue to be separated from flowing blood. From these data, it is possible to quantify CBF accurately in normal subjects with better spatial and temporal resolution than other perfusion techniques such as PET or Xenon-CT.[34]
Imaging of Cerebral Ischemia. Arterial spin labeling is less successful when applied to subjects with cerebral ischemia. This situation is largely due to the short half-life of the applied magnetic tag, which reflects the T1 value of blood. In cerebral ischemia, where perfusion is slow, the magnetic tag may wear off before it reaches the area of interest. Under these circumstances, signal will be lost and CBF will be underestimated. Further experimental studies are required before this technique can be used routinely in clinical practice.
Figure 3. Appearance of acute cerebral infarction on four sequential diffusion-weighted images. The signal hyperintensity within the territory of the right middle cerebral artery indicates extensive infarction.
Diffusion-Weighted Imaging
Diffusion-weighted imaging is a highly sensitive technique for the detection of acute cerebral infarction.[15,29] It confirms hyperacute ischemic damage within the brain before changes are apparent on conventional MR sequences.[29] This is made possible by the ability of diffusion-weighted imaging to detect water movement within the brain parenchyma. Less water movement occurs within a region of severely ischemic brain than in normal brain parenchyma. Diffusion-weighted imaging can detect this difference, allowing the identification of brain tissue that has undergone acute ischemic cellular damage (Fig. 3).

Brownian Motion. To understand diffusion-weighted imaging, it is necessary to appreciate a normal physical process that affects water molecules. Water within the brain parenchyma is continually moving by Brownian motion. This random motion causes molecules to move further away from their original position with time, a process called diffusion. The amount of Brownian motion that a water molecule undergoes depends both on temperature and the presence of physical barriers. Most brain parenchymal water is located in the extracellular space, where few barriers exist. In this location Brownian motion is rapid and leads to significant water diffusion. Much less water is found within the cell, where it is more restrained by the presence of both cell membrane and organelles, leading to less water diffusion.
Technique. The amount of diffusion arising from Brownian motion can be detected using a diffusion-weighted MR sequence. Tissues containing a high amount of water diffusion are dark on diffusion-weighted imaging, whereas tissue without diffusion is bright. MR imaging detects the presence of hydrogen protons, making it highly sensitive to the presence of water. Diffusion-weighted imaging is a special type of MR imaging, which not only detects the presence of water but also whether it is stationary or moving. This feature is made possible by the addition of two magnetic diffusion gradients to a MR pulse sequence. These gradients are applied at different times within the pulse sequence and exactly opposite in their actions. If water is stationary, the second gradient exactly cancels the first, leaving no lasting effect. In this case, all the water protons are included in the MR signal, which is therefore bright. Water protons that move during the time between the gradients cannot be included in the MR signal because the second gradient cannot negate the effects of the first, unless the protons are in the same position. In this case, some of the MR signal is lost and therefore appears darker.
These diffusion gradients are commonly applied separately in three different directions: superior-inferior, anterior-posterior, and right-left to allow the separate detection of water movement in these planes (Fig. 4).
Figure 5. Three-directional, anisotropic diffusion images can be combined together to produce an isotropic diffusion image that provides three-dimensional diffusion information.
It is important to perform such multidirectional diffusion imaging because white matter exhibits a phenomenon called anisotropy, whereby diffusion varies by direction. Diffusion is faster along the direction of myelinated white matter tracts than it is perpendicular to them. Thus, when a diffusion gradient is applied along the direction of a white matter tract, the signal on diffusion-weighted imaging is darker, indicating more rapid water diffusion in this direction. In contrast, gray matter does not exhibit anisotropy and diffusion is equal in all directions. Anisotropic images can be combined to form an isotropic image, which contains diffusion information from all planes (Fig. 5).

If more detailed directional information is required, tensor diffusion imaging can be performed in which a diffusion gradient is applied along six separate axes. This process generates very detailed information but at the expense of both extra imaging and post-processing time. Although tensor imaging may be useful for detecting white matter pathologies, it is unnecessary for imaging acute strokes.
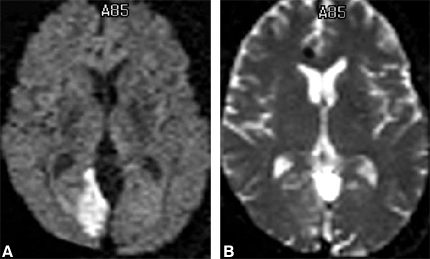
For routine diagnostic purposes, it is easiest to interpret diffusion information on a diffusion-weighted image where areas of decreased diffusion appear as hyperintense signal. It is also possible to generate absolute values for the amount of diffusion within each MR voxel. This value is termed the apparent diffusion coefficient (ADC), and the value in each voxel can be viewed on an ADC map. An area of decreased diffusion with a low ADC would appear dark on an ADC map but bright on a diffusion-weighted image (Fig. 6).

ADC maps have the advantage that they only contain diffusion information and remove background MR signal resulting from T2 and proton density.
Detection of Acute Cerebral Infarction. Diffusion-weighted imaging detects a local decrease in water diffusion in areas of acute cerebral infarction. It appears as an area of increased signal and occurs before T2-weighted changes become apparent (Fig. 7).

The exact cellular mechanism that decreases water diffusion is controversial. However, it is thought to be partly due to a movement of water from the extracellular space into the cell due to developing cytotoxic edema.[18] After severe or prolonged ischemia, reduced arterial flow leads to a depletion of tissue adenosine triphosphate (ATP) and the function of the Na+-K+ ATPase pump declines. Cellular influx of sodium and calcium follows, attracting water from the extracellular space into the cell. Water diffusion is more restricted within the cell than it is in the extracellular space, overall decreasing tissue diffusion.
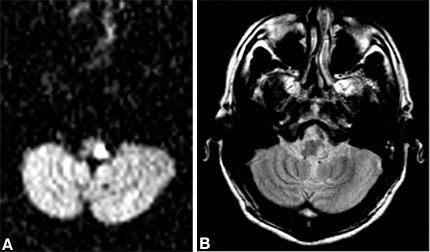
Diffusion-weighted imaging is both sensitive and specific for acute cerebral infarction. Sensitivities of 88 to 98% [15,29] have been recorded, limited by occasional false-negative examinations caused by artifact or small lacunar infarcts. This technique is also useful for detecting brain stem infarction (Fig. 8).
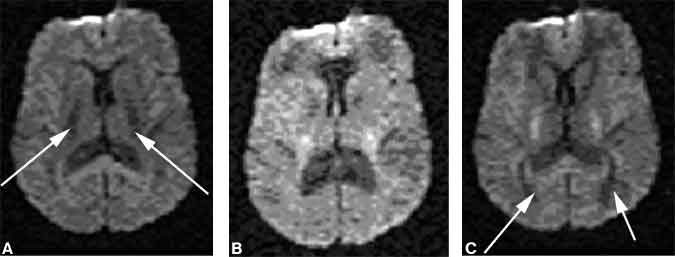
Figure 9. Neonatal hypoxic-ischemic encephalopathy in a 4-day-old neonate. (A) T1-weighted and (B) intermediate-weighted images show signal hyperintensity within the lentiform nuclei. Both the (C) T2-weighted and (D) diffusion-weighted images are normal.
Its use in neonates remains more uncertain. Although diffusion-weighted imaging has proven sensitive for detecting global hypoxic episodes affecting the cortical watershed areas, it has been less successful in detecting deep gray matter insults (Fig. 9).[7] This characteristic may reflect differences in the normal water concentration of neonatal brains compared to adults.

The specificity of diffusion-weighted imaging is similarly high, at 95%.[15] Occasional false-positive examinations result from recent seizure activity, Herpes encephalitis, or nonstroke cellular death. To prevent erroneous interpretation of diffusion-weighted images, it is important to examine T2-weighted images before diffusion-weighted images are interpreted because diffusion-weighted imaging is T2-weighted, and T2 signal hyperintensity from nonischemic causes can shine through onto the diffusion-weighted image.
Diffusion-weighted imaging is also a useful technique for distinguishing acute from chronic cerebral infarction (Fig. 10). This distinction is often difficult to make on conventional MR sequences, but it is important for patient management.
Figure 11. Chart graphing the apparent diffusion coefficient changes over time in several subjects with cerebral infarction. On the vertical axis, the ratio of the apparent diffusion coefficient (ADC) in the normal contralateral hemisphere to the ADC value in the lesion is plotted, with each point representing a different subject. As expected, the ADC value in areas of infarction declines from normal values, increasing this ratio. The horizontal axis indicates the time since symptom onset. The peak ADC ratio occurs two to three days after infarction, indicating that the ADC of the lesion is at its lowest at this time. The ratio returns to normal within 10 to 20 days.
Time Course of Diffusion Changes. Changes in diffusion occur rapidly after the onset of severe ischemia. Animal studies have detected a signal increase on diffusion-weighted images within 2.5 minutes of severe ischemia.[18] In humans, the timing of the first change on diffusion-weighted imaging is less clear due to the inherent delay in imaging stroke patients. Changes, however, have been detected as soon as 39 minutes after symptom onset.[35] The intensity of the signal increases up to 48 hours after insult (Fig. 11).32 The increase indicates a progressive decline in local water diffusion, reflecting increasing water influx into the ischemic cell, and may indicate a target for treatment. After signal intensity peaks, brightness gradually decreases until the abnormality can no longer be detected 4 to 14 days after ictus.[5,22,32] This decline in signal brightness reflects an increase in water diffusion back toward normal values but does not indicate recovery of the ischemic cells. It is caused by the leakage of water, which collects in the extracellular space as vasogenic edema, through the damaged BBB. Consequently, water diffusion increases and ADC is elevated.
Figure 12. Series of diffusion-weighted images in a single patient showing the changes in diffusion that occur over time. Between the first and the second images, both the area of the lesion and the signal intensity increase. The size and hyperintensity of the lesion are maximal at Day 3. Subsequently, they decrease and fade to almost a normal appearance by Day 13.
The size of the area where the diffusion-weighted imaging signal is abnormal often increases during the first 24 hours after symptom onset and may continue to do so beyond 48 hours in some subjects (Fig. 12).[2] This finding suggests a progression in tissue damage in the hours after ictus and reflects an important target for both current and future treatments for acute cerebral ischemia.
Does Diffusion-Weighted Imaging Detect Reversible Cerebral Ischemia? Animal studies have indicated that diffusion-weighted imaging signal changes induced by ischemia may be reversible, either partially or fully, if perfusion is restored within an hour of the insult.[17] In areas that show reversibility, ischemic changes are less prominent and a less intense change in signal reflects a smaller decrease in water diffusion.[17] There may be a threshold value of water diffusion at which point ischemic lesions indicate irreversibly damaged tissue.
Whether similar changes in water diffusion induced by ischemia are also reversible in humans is uncertain. Although intravenous rt-PA has clinical value, no studies have examined whether changes occur in diffusion-weighted imaging or perfusion imaging with successful reperfusion. In most clinical studies, the appearance of a diffusion abnormality indicates a clinical deficit lasting more than 24 hours and consistent with cerebral infarction.[29] Changes on diffusion-weighted imaging may also be seen in subjects with a transient clinical deficit that lasts less than 24 hours.[12] Most of these subjects have evidence of cerebral infarction on subsequent conventional MR imaging. In a few, however, the follow-up MR image is normal. It is unclear whether diffusion-weighted imaging changes in these subjects are due to irreversible infarction, which has not been demonstrated by follow-up MR imaging, or to ischemia that has subsequently reversed. In most subjects, however, diffustion changes reflect irreversible tissue damage, with the area of signal change corresponding to the minimum area of infarction.
Clinical Application of Diffusion and Perfusion MR Imaging
Individually, diffusion and perfusion imaging provides valuable functional information about ischemic brain parenchyma. Diffusion imaging detects severely ischemic dysfunctional tissue in which the neurons are either actually or imminently irreversibly damaged. It provides a measure of neuronal tissue that is irretrievably infarcted and is not thought to be salvageable with thrombolysis. In contrast, perfusion imaging detects all tissue affected by arterial hypoperfusion, including both irreversibly damaged tissue detected by diffusion-weighted imaging and tissue that is potentially viable if local blood flow is restored.
By combining the two imaging methods, it is possible to detect the ischemic penumbra. The penumbra is an area of viable tissue located around the periphery of infarcted tissue.1 The size of the diffusion abnormality most likely increases if the abnormality detected on perfusion imaging is larger than that on diffusion-weighted imaging.[11] This mismatch between a larger perfusion and smaller diffusion abnormality is thought to reflect the presence of an ischemic penumbra. Such a mismatch is more likely to occur if the proximal artery supplying the affected area is occluded,[20] suggesting that angiographic appearance may also be an important predictor of outcome.
Cellular ischemic changes are thought to occur more slowly in the ischemic penumbra, a reflection of a less severe perfusion deficit at this peripheral site. Combined diffusion-perfusion provides a unique opportunity to visualize and quantify the ischemic penumbra and to identify whether salvageable tissue exists for which thrombolysis would be effective. Thrombolysis aims to restore perfusion to this area before cellular damage becomes irreversible, thereby salvaging tissue.
Practical Considerations
As novel therapies for the treatment of stroke are developed, they will likely be more effective the earlier after the insult they are applied. This factor creates challenges for current medical practice. At present only 4% of patients present to hospitals nationwide within 3 hours of symptom onset.[25] If MR imaging is to be performed in subjects presenting with hyperacute ischemic symptoms, it should be both rapid and widely available to minimize delays in progression to treatment. A recent study indicated that a rapid imaging protocol is feasible in subjects with hyperacute stroke.[27] An average MR imaging time of less than 15 minutes was achieved in 41 subjects, with a sequence protocol comprising T2-weighted turbo gradient- and spin-echo images and echo-planar perfusion and diffusion-weighted images. The mean time from entering the emergency department to beginning MR imaging was 45 minutes. If a rapid hyperacute imaging protocol is to be offered before acute stroke treatment, possible delays related to clinical evaluation, transportation, and MR imaging need to be minimized. Such coordination of effort represents a significant organizational challenge. Furthermore, both image postprocessing and radiological interpretation need to be rapid, if imaging results are to influence patient care.

It is important that any imaging method offered for hyperacute stroke reliably detect intracerebral hemorrhage and exclude the presence of this treatment contraindication. Previously, CT was thought to be superior to MR imaging in detecting hyperacute hemorrhage. A recent study, however, has confirmed that susceptibility-weighted MR imaging performed with an echo-planar T2* sequence[14] can reliably detect hemorrhage.
Finally, MR angiography might be added to a hyperacute imaging protocol to assess proximal arterial patency (Fig. 13). This concern is likely to be of particular importance if combined intravenous and intra-arterial thrombolysis becomes an approved treatment for subjects with proximal arterial occlusion. In this situation, MR angiography would render important diagnostic information, which would change patient management.
Even further in the future, some of these techniques might also be of use in defining responses to treatment. Where cardiologists rely upon electrocardiography to detect a reocclusion of coronary vessels and to consider the possibility of repeated thrombolysis, imaging may allow such decisions to be made rationally in the future for stroke patients.
Acknowledgment
The authors thank Shahram Partovi, MD, for graciously providing Figures 11 and 12.
References
- Astrup J, Siesjo BK, Symon L: Thresholds in cerebral ischemia—the ischemic penumbra. Stroke 12:723-725, 1989
- Baird AE, Benfield A, Schlaug G, et al: Enlargement of human cerebral ischemic lesion volumes measured by diffusion-weighted magnetic resonance imaging. Ann Neurol 41:581-589, 1997
- Boxerman JL, Hamberg LM, Rosen BR, et al: MR contrast due to intravascular magnetic susceptibility perturbations. Magn Reson Med 34:555-566, 1995
- Bryan RN, Levy LM, Whitlow WD, et al: Diagnosis of acute cerebral infarction: Comparison of CT and MR imaging. AJNR Am J Neuroradiol 12:611-620, 1991
- Burdette JH, Ricci PE, Petitti N, et al: Cerebral infarction: Time course of signal intensity changes on diffusion-weighted MR images. AJR Am J Roentgenol 171:791-795, 1998
- el Zoppo GJ, Higashida RT, Furlan AJ, et al: PROACT: A phase II randomized trial of recombinant pro-urokinase by direct arterial delivery in acute middle cerebral artery stroke. PROACT Investigators. Prolyse in Acute Cerebral Thromboembolism. Stroke 29:4-11, 1998
- Forbes KPN, Pipe JG, Bird CR: Neonatal hypoxic ischemic encephalopathy: Detection with diffusion-weighted imaging. AJNR Am J Neuroradiol (in press)
- Hacke W, Kaste M, Fieschi C, et al: Intravenous thrombolysis with recombinant tissue plasminogen activator for acute hemispheric stroke. The European Cooperative Acute Stroke Study (ECASS). JAMA 274:1017-1025, 1995
- Hagen T, Bartylla K, Piepgras U: Correlation of regional cerebral blood flow measured by stable xenon CT and perfusion MRI. J Comput Assist Tomogr 23:257-264, 1999
- Heiss WD, Rosner G: Functional recovery of cortical neurons as related to degree and duration of ischemia. Ann Neurol 14:294-301, 1983
- Karonen JO, Vanninen RL, Liu Y, et al: Combined diffusion and perfusion MRI with correlation to single-photon emission CT in acute ischemic stroke. Ischemic penumbra predicts infarct growth. Stroke 30:1583-1590, 1999
- Kidwell CS, Alger JR, Di Salle F, et al: Diffusion MRI in patients with transient ischemic attacks. Stroke 30:1174-1180, 1999
- Lewandowski CA, Frankel M, Tomsick TA, et al: Combined intravenous and intra-arterial r-TPA versus intra-arterial therapy of acute ischemic stroke: Emergency management of stroke (EMS) bridging trial. Stroke 30:2598-2605, 1999
- Linfante I, Llinas RH, Caplan LR, et al: MRI features of intracerebral hemorrhage within 2 hours from symptom onset. Stroke 30:2263-2267, 1999
- Lovblad KO, Laubach HJ, Baird AE, et al: Clinical experience with diffusion-weighted MR in patients with acute stroke. AJNR Am J Neuroradiol 19:1061-1066, 1998
- Marks MP, Tong DC, Beaulieu C, et al: Evaluation of early reperfusion and i.v. tPA therapy using diffusion- and perfusion-weighted MRI. Neurology 52:1792-1798, 1999
- Minematsu K, Li L, Sotak CH, et al: Reversible focal ischemic injury demonstrated by diffusion-weighted magnetic resonance imaging in rats. Stroke 23:1304-1311, 1992
- Moseley ME, Kucharczyk J, Mintorovitch J, et al: Diffusion-weighted MR imaging of acute stroke: Correlation with T2-weighted and magnetic susceptibility-enhanced MR imaging in cats. AJNR Am J Neuroradiol 11:423-429, 1990
- Rempp KA, Brix G, Wenz F, et al: Quantification of regional cerebral blood flow and volume with dynamic susceptibility contrast-enhanced MR imaging. Radiology 193:637-641, 1994
- Rordorf G, Koroshetz WJ, Copen WA, et al: Regional ischemia and ischemic injury in patients with acute middle cerebral artery stroke as defined by early diffusion-weighted and perfusion-weighted MRI. Stroke 29:939-943, 1998
- Rosen BR, Belliveau JW, Buchbinder BR, et al: Contrast agents and cerebral hemodynamics. Magn Reson Med 19:285-292, 1991
- Schlaug G, Siewert B, Benfield A, et al: Time course of the apparent diffusion coefficient (ADC) abnormality in human stroke. Neurology 49:113-119, 1997
- Shermann DG for the STAT Writers Group: Defibrinogenation with viprinex (ancrod) for the treatment of acute ischemic stroke. 24th American Heart Association International Conference on Stroke and Cerebral Circulation, Nashville, TN, February, 1999
- Sorensen AG, Copen WA, Ostergaard L, et al: Hyperacute stroke: Simultaneous measurement of relative cerebral blood volume, relative cerebral blood flow, and mean tissue transit time. Radiology 210:519-527, 1999
- Study Group: Study design of the International Stroke Trial (IST), baseline data, and outcome in 984 randomised patients in the pilot study. J Neurol Neurosurg Psychiatry 60:371-376, 1996
- Study Group: Generalized efficacy of t-PA for acute stroke. Subgroup analysis of the NINDS
t-PA Stroke Trial. Stroke 28:2119-2125, 1999 - Sunshine JL, Tarr RW, Lanzieri CF, et al: Hyper acute stroke: Ultrafast MR imaging to triage patients prior to therapy. Radiology 212:325-332, 1999
- The National Institute for Neurological Disorders and Stroke rt-PA Stroke Study Group: Tissue plasminogen activator for acute ischemic stroke. N Engl J Med 333:1581-1587, 1995
- van Everdingen KJ, van der Grond J, Kappelle LJ, et al: Diffusion-weighted magnetic resonance imaging in acute stroke. Stroke 29:1783-1790, 1998
- Villringer A, Rosen BR, Belliveau JW, et al: Dynamic imaging with lanthanide chelates in normal brain: Contrast due to magnetic susceptibility effects. Magn Reson Med 6:164-174, 1988
- von Kummer R, Allen KL, Holle R, et al: Acute stroke: Usefulness of early CT findings before thrombolytic therapy. Radiology 205:327-333, 1997
- Warach S, Chien D, Li W, et al: Fast magnetic resonance diffusion-weighted imaging of acute human stroke. Neurology 42:1717-1723, 1992
- Williams DS, Detre JA, Leigh JS, et al: Magnetic resonance imaging of perfusion using spin inversion of arterial water. Proc Natl Acad Sci USA 89:212-216, 1992
- Wong EC, Buxton RB, Frank LR: Quantitative perfusion imaging using arterial spin labeling. Neuroimaging Clin N Am 9:333-342, 1999
- Yoneda Y, Tokui K, Hanihara T, et al: Diffusion-weighted magnetic resonance imaging: Detection of ischemic injury 39 minutes after onset in a stroke patient. Ann Neurol 45:794-797, 1999
- Yuh WT, Crain MR, Loes DJ, et al: MR imaging of cerebral ischemia: Findings in the first 24 hours. AJNR Am J Neuroradiol 12:621-629, 1991