


Proliferation Markers in the Evaluation of Gliomas
Author
Stephen W. Coons, MD
Division of Neuropathology, Barrow Neurological Institute, Mercy Healthcare Arizona, Phoenix, Arizona
Abstract
The inconsistent prognoses based on the evaluation of mitotic activity as an estimate of proliferative activity in gliomas have led to interest in other proliferation markers. These markers use a variety of approaches to estimate tumor proliferative activity, including incorporation of nucleotide analogs [3H-thymidine, bromodeoxyuridine (BrdU)], expression of antibodies to nuclear proteins during proliferation [Ki-67/MIB-1, proliferating cell nuclear antigen (PCNA)/cyclin, DNA polymerase], cytometric cell cycle analysis, probes for in situ hybridization (histone 3), and silver staining of nucleolar organizing regions. These molecular markers evaluate different portions of the cell cycle, but all identify a broader range than microscopic identification of mitoses and promise to provide accurate estimates of cellular proliferation. All glioma markers show a good correlation with histological grade, but KI-67/MIB-1 is the most promising. It is suitable for routinely processed tissue and has relatively few methodological concerns compared to the other markers. The focus of most proliferation studies has been on astrocytomas, presumably due to their availability. However, several recent studies using MIB-1 have shown an excellent correlation between proliferation and patient survival in oligodendrogliomas. Also, markers tend to be more predictive of low-grade tumors; consequently, proliferation markers may be more useful for oligodendrogliomas than other estimates of activity. Due to inconsistent grading and classification as well as methodological differences in reported studies, it is not possible to determine “universal” thresholds for any marker. Each institution needs to determine its own thresholds based on its own studies and methods.
Key Words : glioma, prognosis, proliferation
The clinical behavior of a glioma is defined by numerous factors, including host defenses, location, and intrinsic capacity for growth. In diffuse gliomas, growth may cause formation of a mass that compresses adjacent normal structures, widespread brain invasion that ultimately destroys intervening parenchyma, or most commonly, a combination of both patterns. The time course of the development of these destructive lesions is related to the rate of tumor growth, which is linked to the rate of tumor cell proliferation.
Figure 1. The pathways and factors involved with the cell cycle are complicated. Many of the factors shown are overexpressed in human cancers as a result of gene amplification or translocations. A, B, D, and E are cyclin A, B, D, and E.
The mechanisms of glioma cell proliferation are incompletely understood. Complex genetic and molecular pathways regulate the many interacting factors that affect cellular proliferation (Fig. 1). Other factors affect the less well understood counterpart of proliferation, apoptosis or programmed cell death. A combination of these two (at least) competing mechanisms ultimately determines tumor growth. However, from a diagnostic perspective, how a cell proliferates is less important than that it does proliferate. Irrespective of the rate of cell death, high proliferation rates will likely lead to more rapid tumor growth.
The evaluation of mitotic activity as an estimate of tumor proliferative activity is an established tenet of histopathology. The association of higher mitotic activity with more aggressive tumors has had only general significance for systemic tumors. In neuropathology, however, the evaluation of mitotic activity is a cornerstone of several highly predictive grading systems for astrocytomas and several less predictive grading systems for oligodendrogliomas.
The inconsistent prognoses based on estimates of mitotic activity in regard to gliomas have led to interest in other proliferation markers. A number of molecular markers of proliferation have been identified and evaluated to various degrees. These markers use a variety of approaches to estimate tumor proliferative activity, including nucleotide analog incorporation [3H-thymidine, bromodeoxyuridine (BrdU)], antibodies to nuclear proteins expressed during the proliferation [Ki-67/MIB-1, proliferating cell nuclear antigen (PCNA)/cyclin, and DNA polymerase a], cytometric cell cycle analysis, probes for in situ hybridization (histone 3), and silver staining of nucleolar organizing regions (AgNOR).
Figure 2. Illustration showing the portion of the cell cycle identified by the proliferation markers.
These molecular markers evaluate different portions of the cell cycle, but all identify a broader range than microscopic identification of mitoses and promise to provide more accurate estimates of cellular proliferation (Fig. 2). The intense effort to evaluate their diagnostic value also has prompted a reevaluation of mitotic activity, which, despite its limitations, remains the most widely used proliferation marker.
This article discusses the role of mitoses in histological grading and methods of measuring mitotic activity. Molecular markers of proliferative activity are considered in terms of methodological issues and the current data regarding their application to gliomas. Although this review is not comprehensive, particular emphasis is given to those markers for which studies have established prognostic significance.
Mitoses
Histological Grading
The presence of increased mitotic activity is the principal feature that differentiates grade 3 or anaplastic astrocytomas (AA) from lower grade astrocytomas in a number of highly predictive grading systems [e.g., Ringertz,83 Burger et al.,10 Kernohan et al.,59 Daumas-Duport et al.,26 World Health Organization (WHO)].61 Most systems rely on a subjective estimate of the frequency of mitotic activity, using terms like rare, to distinguish lower grade from higher grade tumors where frequent, numerous mitoses are found. This subjectivity hinders both intra- and interobserver diagnostic reliability. The classifications of Daumas-Duport et al.26 and WHO61 avoid subjective evaluation of mitotic frequency by considering only its presence or absence—a single mitosis is sufficient to classify a tumor as grade 3. This desirably simple approach emphasizes the critical role that proliferative activity plays in indicating tumor progression. In other systems, microscopic features other than mitotic activity (e.g., cellularity, atypia) factor into the decision to classify a tumor as grade 3/anaplastic.
Oligodendroglioma grading systems are less predictive than those for astrocytomas, particularly in regard to intermediate-grade tumors. These are precisely the tumors in which mitotic activity plays a central role in predicting behavior and identifying malignant progression in astrocytomas. The difficulties associated with these systems are, in large part, attributable to the way mitotic activity is interpreted. Whereas astrocytoma grading systems concur about the relevance of mitotic figures but differ on how to interpret them, grading systems for oligodendrogliomas differ about whether mitoses have prognostic significance. Smith et al.97 and Mørk et al.,70 for example, found that mitotic activity had no independent prognostic significance. In contrast, Kernohan and coworkers29,100 and Burger et al.8 emphasized the importance of frequent mitoses in distinguishing low grade/grade 1-2 tumors from anaplastic/grade 3-4 tumors.
The lack of quantitative standards has hindered the application of mitotic counts; however, efforts to define how many mitoses are “frequent” have been unsuccessful. Kros et al.63 found that grade 1-2 tumors had 1 to 3 mitoses/10 high-power fields (HPF) compared with 2 to 5 mitoses/10 HPFs in grade 3-4 tumors. Application of the Daumas-Duport et al.26 system to oligodendroglial tumors demonstrated that tumors with even a single mitosis have a worse outcome than those without mitoses. Despite such statistical successes in classifying tumors into prognostic groups based on mitotic activity, this approach is limited. In all of the systems, the survival ranges associated with intermediate grade 2 and 3 tumors are very broad. The overlap is so extensive between grades that their distinction is of questionable utility in regard to individual tumors. The major problem is the failure to identify more aggressive grade 2 tumors while the behavior of some tumors classified as grade 3/anaplastic is relatively indolent.
Methodological Issues
The inconsistent prognostic results associated with estimates of mitotic activity reflect both inherent and methodological problems. There are two basic methods for evaluating mitotic activity: the presence or absence of mitosis, or its frequency. The latter is either measured quantitatively or estimated. These approaches have specific advantages and disadvantages but also share common issues. Mitosis is present during only a very limited portion of the cell cycle. As a result, the number of mitoses greatly underestimates the number of cells that is proliferating at any time. This fact may permit accurate comparisons of proliferative activity between tumors and even accurate estimates of overall proliferation. However, it makes estimates of mitosis more susceptible to sampling errors, which are more of a problem when the event being measured is relatively rare. Sampling errors are related to the extent of examination and can be reduced by examining more microscopic fields. Consequently, the sensitivity of all methods for estimating mitotic activity is related to the examiner’s diligence. Also, mitotic activity continues after the surgical removal of the tumor, and delays in fixation as brief as 15 minutes result in the microscopic identification of fewer mitoses. Inevitable inconsistencies in the intervals before fixation within and between laboratories will cause problems with comparing values among tumors.
Presence vs. Absence
Evaluating only the presence or absence of mitoses has several advantages. Foremost, it is simple to do. It also avoids subjectivity and the often tedious quantitative mitotic estimates. Because grading systems that use the presence-absence approach require only a single mitosis to increase the grade of a tumor, their threshold is the most sensitive for identifying highly proliferative tumors.
Figure 3. The cumulative percentage of cases with mitoses in which the first mitosis was identified by the given field number. (A) All cases (astrocytomas, oligodendroglial tumors). (B) Astrocytomas (all astrocytomas, grade 3, grade 4). (C) Oligodendroglial tumors (all tumors, grades 1+2, grades 3+4).
There are several concerns, both theoretical and practical, regarding this approach. From a theoretical perspective, it seems unlikely that the presence or identification of a single mitosis in a resection specimen that may have thousands of HPFs is equivalent to a mitosis that is one of several within a single HPF in a different tumor. Ultimately, mitotic frequency must have some significance, a view that finds support in relation to the less successful application of this method to oligodendrogliomas. Also, despite the sensitivity of this approach, some WHO grade 2 astrocytomas grow rapidly even when no mitoses are identified. Regardless of whether this paradox reflects the diligence of the examiner, it indicates that evaluating mitotic activity may be too insensitive to classify some tumors properly.
From a practical standpoint, the issues of sampling and an observer’s diligence raise related questions: How many fields must be reviewed before a tumor is considered not to have mitoses, and how large a sample does this require? We reviewed 448 gliomas, including 349 astrocytomas and 99 oligodendroglial tumors, and evaluated the extent of examination necessary to identify a mitosis.22In each case as many as 100 400x-fields were examined, and the number of the field in which the first mitosis was found was noted (Fig. 3). In a few cases, the first mitosis was not found until after 90 or more fields had been examined. This finding confirmed that detection is often a matter of diligence. Indeed, more cases with mitoses may have been found if more than 100 fields had been examined. However, practical concerns dictate that fewer, not more, fields be examined. About 95% of the cases with mitoses were identified by examining 25 HPFs. Consequently, this may be a reasonable number of fields to review, even though some cases with mitoses will be missed. An informal survey of pathologists (SWC, unpublished data) suggested that few pathologists examine more than 10 to 20 400x-fields for mitoses. There is a great potential for missing a rare mitosis, resulting in an incorrect grade and inappropriate therapy.
The ease of finding mitotic figures is related to their frequency. We found that the survival of patients with grade 3 astrocytomas inversely correlated with when the first mitosis was found (p < 0.02). These findings indicate that even though the presence or absence of mitoses can accurately predict survival for patients with gliomas, prognosis could be more accurate if data regarding mitotic frequency were analyzed.
In terms of sample size, a typical 1 x 0.1 x 0.1-cm needle biopsy has the same area as 50 typical 0.2 cm2 HPFs; thus, a representativeneedle biopsy probably provides adequate tissue to evaluate the presence or absence of mitoses.
Frequency
The evaluation of the number of mitoses may be either quantitative or subjective. Subjective estimates of increased, few, or raremitoses take little time but have a correspondingly low level of accuracy and reproducibility. This problem decreases when mitoses are numerous, because such tumors are, in fact, highly proliferative and aggressive.
Quantitative analysis of mitotic activity may involve mitotic counts (MC) or mitotic indices (MI). The former determines the number of mitoses per unit area. It is typically reported as mitoses/HPF; however, the area of such 400x fields differs among microscopes. Estimates of MC in terms of the area (e.g. mitoses/mm2) are preferred. The MI is defined as mitoses/total cells. The MI provides the most accurate mitosis-based estimate of tumor proliferative activity, but its accuracy is related to the number of cells counted. To determine the MI, both the mitoses and the total number of cells in each field must be counted.
When mitoses are rare, many fields may be required to identify, much less to quantify, mitotic activity accurately. Several simplified methods for estimating the total number of cells in a field by counting a statistically determined fraction of cells have been described.38,45 The method of Going,38 for example, which we use in our laboratory in regard to Ki-67/MIB-1 labeling index (LI), allows accurate estimates by counting only 10 to 20% of the total cells, regardless of variations in cell density. Even with statistical methods, there are practical limits on the number of fields that can be reviewed to determine the MI. As a result, the MI is least effective in evaluating cases with relatively low proliferative activity.
Mitotic counts are easy to perform because they only require counting the number of mitoses in a given number of fields (usually 10). MC correlates well with MI for some tumors; however, the correlation is poor for gliomas. The cell density among gliomas is often significantly different. Among tumors with equivalent MIs, the less cellular tumor will have a lower MC. When mitotic activity is high, this inherent inaccuracy becomes irrelevant. Not only do highly proliferative tumors tend to be more consistently highly cellular, but gliomas with a mitosis in every HPF behave aggressively irrespective of cell density. However, when proliferative activity is relatively low and mitoses are hard to find, the MC correlates less strongly with the MI or other proliferation markers.
Correlation with Molecular Markers
A number of studies of gliomas have found a general correspondence between MC and/or MI with the LI (percent of positive cells) of molecular proliferation markers, primarily BrdU and Ki-67.91,96,109 However, this relationship can fail when mitoses are rare. In a series of 127 astrocytomas and oligodendrogliomas, we found that an MC of 0-2/50 HPFs demonstrated a wide range of Ki-67 LI: MC = 0, LI = 0-7; MC = 1, LI = 0-10.8; MC = 2, LI = 1.5-12.3.16 The many cases with a high Ki-67 LI despite little mitotic activity emphasize the relative insensitivity of mitoses compared to molecular markers.
In contrast, cases with numerous mitoses tend to correlate well with molecular methods, but these tumors are usually easy to identify as high grade. Schröder et al.91 believe that such results relate to the use of the MC, which neglects differences in cell densities among tumors, rather than the more accurate MI. They found a logarithmic relationship between MI and the Ki-67 LI. However, the cases with low MC described in our study would have had a similarly low MI; differences in cell density could not account for such widely differing Ki-67 LI. Clearly, corroborative studies between MI and molecular LI, with particular attention to less proliferative tumors, are needed. Currently, the data suggest that the relative insensitivity of mitotic evaluation compared to molecular markers cannot be resolved solely by more accurate methods of counting mitoses.
Molecular Proliferation Markers
3H-thymidine
3H-thymidine was the first molecular proliferation marker to be described. Like nonradiolabeled thymidine, it can be incorporated into the newly synthesized DNA of proliferating cells. Therefore, it is an accurate, specific marker of the S phase. Using the original in vivo approach of Hoshino and Wilson53 for brain tumors, patients are infused (intra-arterially or intravenously) with the radioactive reagent before surgery. The surgical specimen is processed routinely through formalin fixation and paraffin embedding.
More recently, Broggi et al.6 applied an in vitro method to brain tumor biopsies. In this method, the tissue sample is minced and then incubated with 3H-thymidine in growth medium before fixation. Microscopic slides are prepared and developed by autoradiography for a period that has ranged from 10 days (in vitro) to months (in vivo). An LI is determined by counting from 1000 to 10,000 cells in multiple areas, providing an estimate of the average S-phase fraction (SPF) of the tumor. Although the activity is very low, 3H-thymidine has a half-life of 12 years, posing a potential health risk to the patient and community. The in vitro approach obviously minimizes this risk. The long time required to develop the slides is a problem in regard to its use as a diagnostic marker. Finally, incomplete penetration of 3H-thymidine into the tissue results in irregular reactivity.
Two major studies of gliomas have been compiled. Hoshino and colleagues47,52,53 studied 24 gliomas [13 glioblastoma multiforme (GBM), 7 AA, and 4 well-differentiated astrocytomas (WDA)]. The low-grade tumors had an LI < 1 compared to 5-15 for the GBM. An LI < 1 was associated with longer survival, while an LI > 5 was associated with poor survival, irrespective of tumor grade. Broggi and colleagues7,31 labeled 103 gliomas (22 GBM, 28 AA, 53 WDA) and found a correlation with histologic grade as well as with patient survival. In WDA and AA, patients with an LI > 4 had shorter survival times. The LI was not useful in evaluating GBM. Although 3H-thymidine incorporation is no longer used in humans, it is still used in cell cultures. It is of historical importance as the first molecular marker to show potential prognostic value for gliomas.
Bromodeoxyuridine
BrdU is a thymidine analog that also can be incorporated into DNA during synthesis. It offers the same accurate measurement of SPF but avoids the radioactivity of 3H-thymidine. Most studies of BrdU involve in vivo infusion of the agent before biopsy. This cumbersome and expensive process requires fine coordination of preoperative activities. Furthermore, BrdU is used primarily in relation to treatment protocols as a radiation sensitizer and is not widely available. In vitro BrdU labeling is similar to the process for 3H-thymidine: minced tissue is incubated with BrdU in growth medium. Results differ as to the effectiveness of the in vitro approach. Limited tissue penetration allows evaluation only of peripheral areas. Also, labeling varies with incubation delays.
A comparison of BrdU LI using the in vivo and in vitro methods on 110 and 106 gliomas, respectively, found that for tumors of the same grade, the LI of the in vivo group was consistently higher.60 For either method, the incorporated marker is resistant to formalin fixation, and tissue is usually processed routinely for microscopic analysis. In paraffin-embedded sections, BrdU is labeled with a monoclonal antibody and standard immunohistochemical techniques. Typically, more than 1000 cells from several areas are counted to estimate the average SPF. Despite the methodological issues that have limited its widespread use, BrdU labeling in astrocytomas has been evaluated more completely than any other proliferation marker.
Most of the data on BrdU labeling in gliomas are the result of the seminal work done by Hoshino and colleagues,48-51,55,56,65,106 who published numerous studies using BrdU to study both its prognostic significance and the basic biology of glioma proliferation. In a 1992 review, Hoshino48 analyzed 343 astrocytomas, including 170 GBM, 92 AA, and 81 WDA. Subsequent studies have added to this number. Because the more recent studies contain many cases from the earlier series, an exact total of cases is unavailable. Two problems complicate the interpretation of the data. First, many of the series contain both primary and recurrent tumors. Second, the studies reflect the evolution of thought regarding histological grading.
Regardless of these issues, all of the series found a significant association between BrdU LI and grade. In the largest studies, the median LI ranged from 6.7-9.3 for GBM and 1.7-3.0 for AA. For WDA, the median LI was always < 1. In addition, the LI values are highly consistent between series. Despite minor differences, particularly in the LI of high-grade tumors, the median LI of each grade is distinct in each series. The LI was associated with length of patient survival in studies where this factor was evaluated. In a series of 87 low-grade astrocytomas, a multivariate analysis confirmed that a BrdU LI >=1 was associated with shorter survival times.55 For these tumors, the LI was the single most important prognostic factor. Multivariate analysis showed that the LI also was associated with the length of patient survival for AA.
In the largest single series of 42 AA,49 LI ranges of 0-2.7, 2.8-5.4, and >5.4 defined groups of tumors with significantly different lengths of patient survival. Although patients whose GBM had a lower LI fared better, multivariate analysis did not find a significant association after age was considered. As a group, patients with high-grade tumors had worse outcomes than patients with low-grade tumors, even when their LIs were similar. Along with the decreased association between the LI and patient survival in high-grade tumors, this finding indicates that factors other than just proliferative activity contribute to the malignancy of these tumors. A study by Ritter et al.84supports this position. In a series of 55 primary and 49 recurrent GBM from 98 patients, there was no association between the LI and length of survival for either group of tumors. However, the median LI of the primary tumors (6.8) was significantly different from that of the recurrent tumors (2.6; p < 0.0001).
There are few BrdU data on oligodendrogliomas, but Wacker et al.106 did evaluate 46 primary and recurrent mixed oligoastrocytomas. The median LI of the primary group was < 1. When a threshold of LI > 5 was used, there was a highly significant association between the LI and time to recurrence: 4.5 months for an LI > 5; not reached for an LI <= 5. The length of patient survival was associated with the LI as a continuous variable but not using the threshold. However, the data suggest that an LI > 5 is an appropriate threshold for treatment decisions. Note that this value is markedly different from the LI >= 1 threshold for astrocytomas.
In a number of other studies, BrdU labeling is compared to other molecular markers, primarily Ki-67, PCNA, and PCNA and DNA polymerase a. In general, the data are typical of those noted above. Correlations with specific markers are discussed in the context of each marker and in the summary.
KI-67/MIB-1
The Ki-67 and MIB-1 antibodies detect a proliferation-associated nonhistone nuclear protein.5,33,34,90,104 This protein is present during the G1, S, and G2/M phases but absent during G0. Expression of the protein may not develop until late G1 in cells newly entering the proliferative portion of the cell cycle from G0, but it is present throughout G1 in cells that return directly to G1 after mitosis.90 Both the intensity of protein expression and nuclear distribution increase throughout the cell cycle.
The first Ki-67 antibody to this protein, described by Gerdes in 1983,35 was not reactive in formalin-fixed tissue. Although special nonformalin fixation techniques reportedly allowed paraffin-embedded sections to be analyzed, almost all of the early studies in brain tumors used frozen sections or smear preparations. The antibody was somewhat capricious and the method required careful attention to detail; however, positive cells were clearly labeled, avoiding the problems of interpretation associated with PCNA.
A “paradoxical” elevation of Ki-67 labeling in cells with experimental protein kinase C inhibition has been reported.23 Despite a decrease in 3H-thymidine and flow cytometry (FC) estimates of SPF and therefore a real decrease in proliferative activity, the Ki-67 remained high. This result was attributed to an accumulation of cells that were blocked in G1. This experimental disconnection between the protein expression and proliferative activity does not appear to occur in vivo. For practical purposes, the Ki-67 antibody appears to be a highly sensitive marker of growth fraction, identifying almost all of the cells in the proliferating pool. Recently, several antibodies, most notably MIB-1, have been developed for use in formalin-fixed paraffin-embedded tissue. These antibodies offer the potential for reproducible measurements of tumor proliferative activity using routinely processed tissue. As of yet, however, there are few published studies of gliomas using MIB-1.
In general, many studies of astrocytomas have reported a correlation between the Ki-67 LI and histological grade.4,9,17,27,30,36,46,57,68,75,77,79,82,86,92,93,107 The median or mean LI ranged from 0.38-4 for grade 2/WDA, from 2.48-13.8 for grade 3/AA, and from 4.5-18.5 for grade 4/GBM. Note the overlap between the grade 3/AA and the grade 4/GBM values. In fact, the LI has been higher in the grade 3/AA group in several series. In contrast, the mean/median LI of the grade 2/WDA series was consistent across grades and distinct from the values of the higher grade tumors. Most studies have shown a wide range of LIs within each grade, suggesting that analysis of the LI in relation to patient survival might identify tumors whose behavior was not predicted by the grade.
Several small series have attempted such analyses. Montine et al.68 analyzed 36 astrocytomas and found an association between the LI and patient grade. The multivariate analysis of survival found the LI to be a more significant prognostic variable than histological grade (p = 0.002). An LI >= 7.5 maximized the hazard ratio. The median patient survival for an LI < 7.5 was 30 months compared to 12 months for an LI >= 7.5. These values roughly corresponded to the median survival of the grade 3 (29 months) and grade 4 (9 months) tumors in the study. However, when only grade 2 tumors were considered, an LI > 3 identified a group of more aggressive tumors. Because this is the group for which the LI is likely to be the most relevant, Montine et al.68 suggested that the lower LI was a more appropriate threshold for predicting aggressive tumor behavior. In a series of 77 GBM, Pigott et al.79 found no association between Ki-67 LI and survival, supporting the view that measurement of proliferation has a limited role in high-grade astrocytomas.
Several other series with few low-grade astrocytomas have had similar negative results. In a larger series, Ellison et al.30 analyzed 123 astrocytomas, including 24 WDA. As expected, the LI was associated with histological grade (p < 0.00001). When analyzed as a continuous variable, a lower LI was associated with a longer survival (p < 0.004). Also, patients whose tumors had an LI < 2 had longer survivals (p < 0.0001). However, this latter significance was lost when adjusted for grade. In a multivariate analysis of 50 astrocytomas, Sallinen et al.86 found that the Ki-67/MIB-1 LI had prognostic significance after accounting for histological grade. Furthermore, an LI threshold of 15.3 identified different prognostic groups. Wakimoto107 analyzed 72 astrocytomas including 19 low-grade tumors. When analyzed as a continuous variable, the Ki-67/MIB-1 LI was a statistically significant independent prognostic factor for all grades of astrocytomas (p < 0.03). Prognostic thresholds were not determined.
We evaluated the relationship between MIB-1 and survival in a series of 96 tumors—32 WDAs and 64 AAs.18 The length of patient survival was highly associated with the LI for all tumors (p < 0.0001). Kaplan-Meier analysis demonstrated that an LI < 1, LI=1-4, and LI > 4 classified the tumors into prognostic groups. The median survival of each group was 1122, 603, and 199 days, respectively. Survival within each grade also was associated with the LI. For the WDA, the same thresholds were identified, with median survivals of 1485, 688, and 404 days (p < 0.001). For the AA, only two groups were identified: an LI <= 4 was associated with a median survival of 688 and an LI > 4 was associated with a median survival of 200 days (p < 0.001). Of particular interest, an equivalent LI predicted different lengths of survival for each grade. This finding suggested that the process of progression to AA involves changes in addition to an increase in proliferative activity.
The data reviewed above are from 18 studies that analyzed more than 1000 astrocytomas. In contrast, the same studies analyzed only 108 oligodendroglial tumors. These reports only noted a general trend toward a correlation between the LI and histological malignancy. In general, low-grade oligodendroglial tumors had similar or higher LIs than WDA (mean/median LI = 1.2-6), while the high-grade tumors had an LI similar to their astrocytoma counterparts (5.3-11.1).
Several recent studies have demonstrated a strong association between the MIB-1/Ki-67 LI and survival in oligodendrogliomas.20,44,62We analyzed 81 tumors—55 oligodendrogliomas and 26 oligoastrocytomas—and correlated the Ki-67/MIB-1 LI with patient survival and clinical variables.20 In a multivariate analysis of survival, after accounting for histologic grade and age at diagnosis, the LI was associated with patient survival (p = 0.04) as a continuous variable. The data suggested that an LI threshold of 5 would divide the tumors into prognostic groups. Median survival for an LI < 5 was 1718+ days (the median had not been reached) compared to 452 days for an LI >= 5 (p < 0.0001). The LI more accurately predicted survival among grade 2 and 3 tumors than the grade itself. As a whole, the median survival of grade 2 tumors was 1420 days. The 12 grade 2 tumors with an LI >= 5 had a significantly different median survival of 612 days (p < 0.001), which corresponded closely to the survival of grade 3 tumors as a whole (575.5 days). Similarly, the four grade 3 tumors with an LI < 5 had survivals closer to those of grade 2 tumors. These data suggest that measurement of proliferative activity can identify a subset of low-grade oligodendroglial tumors that behaves like anaplastic tumors. In an analysis of 32 low-grade tumors, Heegaard et al.44 found an association between the LI and patient survival, with an LI threshold of three distinguishing subsets of less and more aggressive tumors. Kros et al.62 analyzed 108 oligodendrogliomas and also confirmed the prognostic usefulness of MIB-1. Three prognostic groups were determined, with an L1 < 10, 10-20, and >20. Note that the LI thresholds in these studies differed significantly.
Overall, the data from a large number of cases in multiple studies are similar. The association between the Ki-67/MIB-1 LI and histological grade in both astrocytomas and oligodendrogliomas is clear. Analyses of the prognostic significance of the LI indicate a probable relationship for low-grade tumors that is far less clear for high-grade tumors. Also, the LI may be more useful in regard to oligodendrogliomas, where the threshold for identifying aggressive tumors is higher.
Proliferating Cell Nuclear Antigen (Cyclin)
PCNA, formerly called cyclin (but not a cyclin), is a 36-kD nonhistone acidic nuclear protein that functions as an auxiliary protein to DNA polymerase d.32,108 It is involved in both DNA repair and replication. Reports differ regarding its expression in the cell cycle. Expression increases in late G1 through the S phase and decreases in G2. Some reports24 say that it is undetectable by immunohistochemistry by the M phase, while another108 believes that its 20-hour half-life means that it persists long after mitosis and may be found in noncycling G0 cells. Furthermore, expression increases in noncycling cells during DNA repair and PCNA levels are affected by growth factors. Antibodies to PCNA allow detection in paraffin sections.
Early studies of PCNA in gliomas reported problems because of different staining intensities among cells (so-called light cells and dark cells). Counts that included the light cells led to a remarkably high LI in minimally proliferative tumors. The basis for this pattern is unknown. In recent series, only Allegranza et al.2 discussed this issue and did not count lightly staining cells as positive. Among some series, however, there is a marked difference between the PCNA LI reported for the same grade of glioma. Sallinen et al.85 investigated the sources of variation in PCNA labeling in 104 gliomas. He found differences related to the antibody clone, antigen retrieval methods, and even the counterstain.
Most studies have found that the PCNA LI was correlated with Ki-67 and/or BrdU LI.2,14,28,54,72,74,86,88,89,94 However, the nature of this relationship, particularly for PCNA and Ki-67 labeling, is unclear. Dervan et al.28 found that the PCNA and Ki-67 LIs were equivalent. However, Sallinen et al.86 found that PCNA LIs were much lower than MIB-1 LIs in 50 gliomas, but his data for MIB-1 were higher than those reported by other investigators. In a dual labeling study, Coltrera and Gown14 reported that PCNA-positive cells were a subset of Ki-67 positive cells and that a PCNA+/Ki-67– cell was rare. In contrast, in series of 31 and 63 gliomas, respectively, Hoyt et al.54 and Allegranza et al.2 found that PCNA labeling was higher than Ki-67. Louis et al.66 found no consistent relationship between the two methods.
Despite the differences among institutions, most studies of PCNA have found a good correlation between the LI and histological grade.2,3,14,28,54,86,88,101,102 Compared to other methods, there has been a broader range of values corresponding to each grade among different series. For WDA, median or mean LI values have ranged between 0.65 and 3.17. For AA, the LIs have ranged from < 2 to 15.8. GBM LIs have ranged from < 4 to 29.8. In general, PCNA labeling has more methodological concerns than Ki-67/MIB-1, resulting in greater interinstitutional variation.
Several studies3,58,86,102,105 have evaluated PCNA LI and survival. Consistent with the findings using other markers, no association between survival and LI was found in a series of 27 GBM despite LIs that varied from 5.2 to 63.7.58 In a study of 73 astrocytomas, an LI > 6 was associated with a poor prognosis.3 However, this significance was lost when grade, age, and Karnofsky performance status were included. Theunissen and Blaauw102 found similar results in a series of 42 astrocytomas, with the prognostic significance of the PCNA LI disappearing in multivariate analysis. The most striking feature of this study was that the LI threshold was 50. Prognostic significance for the PCNA LI was found by multivariate analysis in two studies. For the 45 tumors in the series of Sallinen et al.,86 the PCNA, MIB-1, and BrdU LI all had prognostic significance, but multivariate analysis found that the MIB-1 LI more accurately predicted patient outcome. A PCNA LI of 1.6 predicted a poor outcome. In the largest series, Vigliani et al.105 correlated the LI with survival for 77 cases of WDA. Based on their data for AA, an LI threshold of 5 was used. The median survival for an LI < 5 was 1295 days contrasted with 495 days for an LI > 5 (p = 0.0009). In a multivariate analysis that included age, Karnofsky status, and extent of resection, the PCNA LI was the most significant prognostic factor (p < 0.001). There are two concerns regarding this study. First, tumors with up to 2 mitoses/10 HPF were included as WDA; in most systems, these tumors would be grade 3 or anaplastic. Second, the multivariate analysis was not significant for patient age. In gliomas, this variable is usually the most significant prognostic feature after grade.
Scant data are available regarding oligodendroglial tumors. As expected, the LI of low-grade and high-grade tumors tends to parallel that of their astrocytoma counterparts.
Figure 4. Ki-67/MIB-1 immunohistochemistry of three histologically equivalent low-grade oligodendrogliomas. The tumors have significantly different levels of proliferative activity.
DNA Polymerase a
DNA polymerase a is the principal replicating polymerase in actively proliferating cells. It is present in G1 through G2/M phases but not in G0.64,95,99 As such, it is a potential marker of growth fraction. Anti-DNA polymerase a is not reactive in formalin-fixed tissues. Few reports have evaluated DNA polymerase a expression as a marker for proliferating cells in brain tumors. Kunishio et al.64 evaluated 16 astrocytomas and 2 oligodendrogliomas and compared the DNA polymerase a LI to the Ki-67 LI. The DNA polymerase a LI was correlated with both histological grade and the Ki-67 LI. However, the DNA polymerase a LI was consistently higher. Shibuya et al.95 evaluated the DNA polymerase a , Ki-67, and BrdU LI and AgNOR expression of 67 diffuse gliomas, including 34 GBM, 11 AA, 12 WDA, and 10 anaplastic oligoastrocytomas. The DNA polymerase a LI correlated most highly with the Ki-67 LI (r = 0.94) and then with the BrdU LI (r = 0.84). AgNOR expression was less well correlated. The DNA polymerase a LI was highly correlated with histological grade with values higher than those for Ki-67 or BrdU LI. No prognostic series are reported. Few data are available regarding oligodendrogliomas. The findings suggest that DNA polymerase a may be a more sensitive measure of growth fraction than Ki-67; however, the inability to evaluate paraffin-embedded material will limit its usefulness.
Cytometric Cell-Cycle Analysis
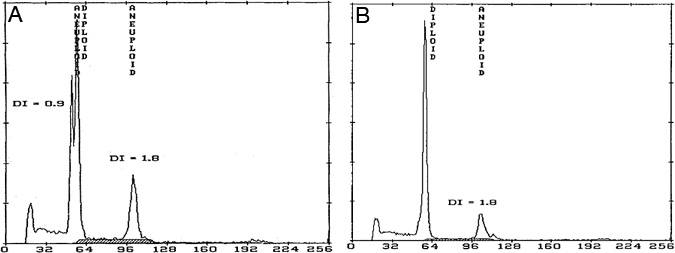
Cell-cycle analysis by either FC or image cytometry (IC) takes a different approach to estimating proliferation.19,87 The DNA content of individual cells is measured using either fluorescent markers such as propidium iodide (FC) or with the Feulgen reaction (IC). Both bind stoichiometrically to DNA; therefore, the intensity of their staining or fluorescence is proportional to the DNA content. Because these methods use an increase in DNA content to identify proliferating cells, they can distinguish cells in S and G2/M phases but not cells in G1, which have the same DNA content as G0 cells. Histograms that show the number of cells and their relative DNA content are generated (Fig. 4). Proliferation can be estimated by the total of the SPF and G2/M cells or, more commonly and accurately, by the SPF alone.

FC can be done on either fresh or paraffin-embedded tissue. The former offers the advantage of less cellular debris and slightly improved resolution; the latter offers routine processing and widespread availability of samples. FC requires significantly more tissue than IC or other slide-based markers. From one to three 50-µm sections are usually required—a criterion that has limited the use of FC in small specimens. FC offers several advantages over either IC or the immunohistochemical markers. It allows evaluation of large numbers of cells, typically 10,000+, in a short time. Also, FC measurements are a true average of the sample, avoiding the dilemma of microscopic field selection. Specifically compared to IC, FC provides better resolution of DNA content, and the more sharply defined G0/G1 and G2/M peaks allow more accurate and reproducible measurements of the SPF. Significant technical difficulties are associated with the analysis of the SPF by either method. Cutting paraffin sections results in fragments of cells being present, and this debris may fall in the S-phase region. More problematic is the presence of aneuploid peaks, which result in overlap between the G0/G1 and G2/M peaks and the S-phase region of different populations within a tumor. Even with newer analysis programs, the presence of more than one aneuploid peak almost precludes calculation of the SPF (Fig. 5). The FC-determined SPF is really an estimate of proliferative activity and probably does not measure the S phase accurately.
The problems related to cell cycle analysis have led a number of authors to conclude that cytometric proliferation cannot be assessed in gliomas, and most studies address only tumor ploidy. Nevertheless, we have found that careful preparation techniques and modern cell cycle analysis programs allow reproducible measurements of the SPF. Several early small series of astrocytomas found an association between SPF and survival or histological grade.1,12,25,98,110 More recently, in the study that compared MIB-1, PCNA, and FC in 50 astrocytomas, Sallinen et al.86 found that the FC SPF was highly associated with the length of patient survival. These studies provide little or no data regarding oligodendrogliomas.
We reported FC SPF measurements in 230 astrocytomas with multivariate analysis of survival.19 The median SPFs of the 27 WDA, 59 AA, and 144 GBM were 4.3, 6.5 and 7.2, respectively. The tumors were stratified based on SPF ranges of < 3, 3-5.9, and >= 6. After accounting for both grade and age, the SPF group was significantly associated with survival, with a higher SPF being associated with an increased risk of death (p < 0.01). The SPF was most useful in predicting aggressive behavior in WDA and less so for predicting the behavior of high-grade tumors. Nevertheless, for high-grade tumors in patients of the same age, outcome was associated with the SPF group. In contrast, Salmon and Kiss87 analyzed the proliferative activity of 39 WDA, 41 AA, and 141 GBM using IC and found no association between tumor proliferative activity and either grade or ploidy type. The association with length of patient survival was not evaluated. In this study, proliferation thresholds of < 5, 5-10, and >10 were set arbitrarily.
In the largest FC series to date, we also evaluated the relationship between SPF and survival in 60 oligodendrogliomas and oligoastrocytomas.21 In the multivariate analysis, SPF, patient age, and histological grade were associated with survival (p < 0.001). As with the astrocytomas, the tumors were stratified into three SPF groups (< 3, 3-5.9, >6). The Kaplan-Meier analysis found significantly different lengths of survival among the groups. Of particular importance, a similar association was found when the problematic grade 2 and 3 tumors, which comprise the majority of oligodendroglial tumors (75% in this series), were considered alone. The SPF identified both more aggressive grade 2 tumors and less aggressive grade 3 tumors. The highly significant association between the SPF and survival sharply contrasts with the inconsistent results of mitosis evaluation in this regard.
S-phase measurements are affected by preparation methods and the analysis program. As a result, interinstitutional reproducibility typically is poor. However, with proper testing, data from different institutions can be compared. In a series of 20 cases using paired serial sections of gliomas, we found a high correlation between SPF measurements at our institution and at the Mayo Clinic (r = 0.87; SWC, unpublished data). However, their SPF values were consistently 3 to 4% higher than ours. Without such correlative data, it is impossible to compare data between institutions. The need for each institution to establish its own thresholds will limit the ultimate usefulness of FC SPF measurements for evaluating gliomas.
Nucleolar Organizing Regions
Nucleolar organizing regions (NORs) are 18S-28S loops of DNA containing repetitive sequences of ribosomal RNA genes that regulate protein synthesis, cell growth, and differentiation.13 In this regard, NORs may not be specifically related to the cell cycle. In 1976, a silver-staining technique, which marked a protein that binds to the rRNA, allowed their identification and led to their common name: AgNOR. The technique was first applied to paraffin sections in 1987. Section thickness affects AgNOR counts. Whereas thick sections may cause identification problems related to focusing, thin sections may cut off AgNORs and reduce counts. Also, individual AgNORs may not be distinguishable when they overlap. After a brief flurry of reports regarding AgNORs in gliomas, the method seems to have lost favor.39-43,67,71,78,80,81,103
In general, AgNORs correlate with histological grade in most individual studies, but two studies found no difference between low- and high-grade tumors. Comparisons between studies demonstrate consistent disparities. Mean AgNOR counts of well-differentiated astrocytomas vary and overlap significantly among studies. Studies have shown an inconsistent correlation between AgNOR and the Ki-67 and BrdU LI and MI. Nicoll and Candy71 found no association between AgNOR counts and survival in the only series to evaluate prognostic value.
Intermarker Correlations
General relationships between markers were noted above. Various studies have used linear regression analysis to quantify these relationships.11,37,69,72,74,89,94 Theoretically, not only could the expression of one marker be predicted by another, but a threshold of prognostic significance for one marker could predict the threshold of another marker. At this time, the data do not support such an action. For example, five reported formulas yield quite different Ki-67 LI values for any given BrdU LI.69,72,74,89,94 Norms for each marker need to be determined directly. Ultimately, it may be possible for universal norms to be developed for a relatively reproducible marker such as MIB-1. Currently, however, it is necessary for each institution to establish its own norms.
Methodological Issues
A number of studies using a variety of methods have noted the problem of tumor heterogeneity.15,16,24,73,76 Several of these studies demonstrated a wide range of proliferative activity across a stereotactic trajectory.24,73,76 Our studies of regionally mapped astrocytomas and oligodendrogliomas based on both FC SPF and Ki-67 LI groups found that about 20% of areas significantly underestimate the SPF or Ki-67 LI of more proliferative regions.15,16 In general, heterogeneity is far more pronounced in high-grade tumors, while low-grade tumors tend to have more uniformly diffuse proliferative activity. This problem points out the great potential for sampling errors and the need for review and selection of appropriate material for evaluation.
The issue of sample selection has other implications. FC provides an average SPF estimate of the entire sample. Therefore, it is important to mark the block so as to retrieve only representative tumor. In contrast, practical considerations limit microscopic methods to the evaluation of only a few HPF. There are two approaches for selecting the microscopic fields for determining an LI. Either “representative” fields can be selected in an effort to arrive at an average LI, or fields are chosen in the region of highest apparent activity. The literature is about equally divided in support of the two approaches. Statistical considerations favor the highest activity approach, which also is probably more reproducible. The use of representative areas determines an average in name only. The selection of fields to determine a statistically valid average would require an analysis of the variability of an LI within a tumor type in order to determine the number of randomly chosen fields to count.
Most LIs are determined using visual cells counts. However, a number of investigators use image analysis systems to perform automated counts. Overlapping cells can cause inaccurate results or require tedious manual corrections. Area measurements (i.e., the percentage of nuclear area that is labeled compared to total nuclear area) have been used to circumvent this problem and appear to be an effective solution. In a study using PCNA, Sallinen et al.85 validated the use of such measurements in comparison with visual counts.
Conclusion
Molecular markers offer the potential for estimating proliferative activity accurately in gliomas, and a number of studies have indicated their potential prognostic usefulness. Of the available markers, Ki-67/MIB-1 is the most promising. It is suitable for routinely processed tissue and has relatively few methodological concerns compared to the other markers. In particular, discrepancies among studies using PCNA make it less suitable until its methodological problems can be resolved. Problems with inconsistent grading and classification as well as methodological differences preclude exact comparisons among studies, even those using the same marker. As a result, it is not yet possible to determine “universal” thresholds for any marker. Each institution needs to determine its own norms based on its own specific methods.
The focus of most proliferation studies has been on astrocytomas, presumably due to their availability. However, the recent studies using MIB-1 have shown an excellent correlation between proliferation and survival in oligodendrogliomas. Also, markers typically are more helpful regarding low-grade tumors. Whereas grade 2 astrocytomas are relatively rare, most oligodendrogliomas are low grade. In addition, using current histological definitions, low-grade oligodendroglial tumors outnumber low-grade astrocytomas. Consequently, proliferation markers may be more useful for oligodendrogliomas.
References
- Ahyai A: Flow cytometric analysis of cellular DNA content in human astrocytomas and oligodendrogliomas. Neurosurg Rev 11:177-187, 1988
- Allegranza A, Girlando S, Arrigoni G, et al: Proliferating cell nuclear antigen expression in central nervous system neoplasms.Virchows Arch A Pathol Anat Histopathol 419:417-423, 1991
- Ang LC, Plewes M, Tan L, et al: Proliferating cell nuclear antigen expression in the survival of astrocytoma patients. Can J Neurol Sci 21:306-310, 1994
- Böker DK, Stark HJ: The proliferation rate of intracranial tumors as defined by the monoclonal antibody KI 67. Application of the method to paraffin embedded specimens. Neurosurg Rev 11:267-272, 1988
- Braun N, Papadopoulos T, Müller-Hermelink HK: Cell cycle dependent distribution of the proliferation-associated Ki-67 antigen in human embryonic lung cells. Virchows Arch B Cell Pathol Incl Mol Pathol 56:25-33, 1988
- Broggi G, Franzini A, Costa A, et al: Cell kinetics of neuroepithelial tumors in serial stereotactic biopsies. A new combined approach.Appl Neurophysiol 48:472-476, 1985
- Broggi G, Franzini A, Ferraresi S, et al: Cell kinetics and multimodal prognostic evaluation in glial tumours investigated by serial stereotactic biopsy. Acta Neurochir (Wien) 94:53-56, 1988
- Burger PC, Rawlings CE, Cox EB, et al: Clinicopathologic correlations in the oligodendroglioma. Cancer 59:1345-1352, 1987
- Burger PC, Shibata T, Kleihues P: The use of the monoclonal antibody Ki-67 in the identification of proliferating cells: Application to surgical neuropathology. Am J Surg Pathol 10:611-617, 1986
- Burger PC, Vogel FS, Green SB, et al: Glioblastoma multiforme and anaplastic astrocytoma. Pathologic criteria and prognostic implications. Cancer 56:1106-1111, 1985
- Butti G, Gaetani P, Danova M, et al: Cell kinetic studies of human intracranial tumors. J Neurosurg Sci 33:47-53, 1989
- Cho KG, Nagashima T, Barnwell S, et al: Flow cytometric determination of modal DNA population in relation to proliferative potential of human intracranial neoplasms. J Neurosurg 69:588-592, 1988
- Cibull ML, Heryet A, Gatter KC, et al: The utility of Ki67 immunostaining, nuclear organizer region counting, and morphology in the assessment of follicular lymphomas. J Pathol 158:189-193, 1989
- Coltrera MD, Gown AM: PCNA/cyclin expression and BrdU uptake define different subpopulations in different cell lines. J Histochem Cytochem 39:23-30, 1991
- Coons SW, Johnson PC: Regional heterogeneity in the DNA content of human gliomas. Cancer 72:3052-3060, 1993
- Coons SW, Johnson PC: Regional heterogeneity in the proliferative activity of human gliomas as measured by the Ki-67 labeling index. J Neuropathol Exp Neurol 52:609-618, 1993
- Coons SW, Johnson PC: MIB-1/Ki-67 labeling index predicts patient survival for oligodendroglial tumors. J Neuropathol Exp Neurol 54:440, 1995
- Coons SW, Johnson PC: Ki-67/MIB-1 labeling index predicts patient survival in low grade and anaplastic astrocytomas. J Neuropathol Exp Neurol 55:655, 1996
- Coons SW, Johnson PC, Pearl DK: Prognostic significance of flow cytometry deoxyribonucleic acid analysis of human astrocytomas. Neurosurgery 35:119-126, 1994
- Coons SW, Johnson PC, Pearl DK: The prognostic significance of Ki-67 labeling indices for oligodendrogliomas. Neurosurgery 40: 878-885, 1997
- Coons SW, Johnson PC, Pearl DK, et al: Prognostic significance of flow cytometry deoxyribonucleic acid analysis of human oligodendrogliomas. Neurosurgery 34:680-687, 1994
- Coons SW, Pearl DK: Mitosis identification in diffuse gliomas: Implications for tumor grading. Cancer (In Press)
- Couldwell W, Weiss M, Law R, et al: Paradoxical elevation of Ki-67 labeling with protein kinase inhibition in malignant gliomas. J Neurosurg 82:461-468, 1995
- Dalrymple S, Parisi J, Roche P, et al: Changes in proliferating cell nuclear antigen expression in glioblastoma multiforme cells along a stereotactic biopsy trajectory. Neurosurgery 35:1036-1045, 1994
- Danova M, Giaretti W, Merlo F, et al: Prognostic significance of nuclear DNA content in human neuroepithelial tumors. Int J Cancer 48:663-667, 1991
- Daumas-Duport C, Scheithauer B, O’Fallon J, et al: Grading of astrocytomas. A simple and reproducible method. Cancer 62:2152-2156, 1988
- Deckert M, Reifenberger G, Wechsler W: Determination of the proliferative potential of human brain tumors using the monoclonal antibody Ki-67. J Cancer Res Clin Oncol 115:179-188, 1989
- Dervan PA, Magee HM, Buckley C, et al: Proliferating cell nuclear antigen counts in formalin-fixed paraffin-embedded tissue correlate with Ki-67 in fresh tissue. Am J Clin Pathol 97:21-28, 1992
- Earnest F, III, Kernohan JW, Craig WM: Oligodendrogliomas. A review of two hundred cases. Arch Neurol Psychiatry 63:964-976, 1950
- Ellison DW, Steart PV, Bateman AC, et al: Prognostic indicators in a range of astrocytic tumours: An immunohistochemical study with Ki-67 and p53 antibodies. J Neurol Neurosurg Psychiatry 59:413-419, 1995
- Franzini A, Broggi G, Giorgi C, et al: Predictive accuracy of cell kinetics data in glial tumors investigated by serial stereotactic biopsy. J Neurosurg Sci 33:43-45, 1989
- Garcia RL, Coltrera MD, Gown AM: Analysis of proliferative grade using anti-PCNA/cyclin monoclonal antibodies in fixed, embedded tissues. Comparison with flow cytometric analysis. Am J Pathol 134:733-739, 1989
- Gerdes J: Determination of the growth fraction by means of immunostaining with monoclonal antibody Ki-67. Acta Histochem Suppl 36:437-446, 1988
- Gerdes J, Lemke H, Baisch H, et al: Cell cycle analysis of a cell proliferation-associated human nuclear antigen defined by the monoclonal antibody Ki-67. J Immunol 133:1710-1715, 1984
- Gerdes J, Schwab U, Lemke H, et al: Production of a mouse monoclonal antibody reactive with a human nuclear antigen associated with cell proliferation. Int J Cancer 31:13-20, 1983
- Giangaspero F, Doglioni C, Rivano M, et al: Growth fraction in human brain tumors defined by the monoclonal antibody Ki-67. Acta Neuropathol (Berl) 74:179-182, 1987
- Girino M, Riccardi A, Danova M, et al: Immunocytochemical evaluation of proliferative activity in human brain tumours. Anal Cell Pathol 2:269-275, 1990
- Going JJ: Efficiently estimated histologic cell counts. Hum Pathol 25:333-336, 1994
- Hara A, Hirayama H, Sakai N, et al: Correlation between nucleolar organizer region staining and Ki-67 immunostaining in human gliomas. Surg Neurol 33:320-324, 1990
- Hara A, Hirayama H, Sakai N, et al: Nucleolar organizer region score and Ki-67 labeling index in high-grade gliomas and metastatic brain tumours. Acta Neurochir (Wien) 109:37-41, 1991
- Hara A, Sakai N, Yamada H, et al: Nucleolar organizer regions in vascular and neoplastic cells of human gliomas. Neurosurgery 29:211-215, 1991
- Hara A, Sakai N, Yamada H, et al: Proliferative assessment of GFAP-positive and GFAP-negative glioma cells by nucleolar organizer region staining. Surg Neurol 36:190-194, 1991
- Hara A, Sakai N, Yamada H, et al: Rapid detection of proliferating potential in human brain tumors by nucleolar organizer region staining on squash preparations. J Cancer Res Clin Oncol 117:510-514, 1991
- Heegaard S, Sommer HM, Broholm H, et al: Proliferating cell nuclear antigen and Ki-67 immunohistochemistry of oligodendrogliomas with special reference to prognosis. Cancer 76:1809-1813, 1995
- Hilsenbeck SG, Allred DC: Improved methods of estimating mitotic activity in solid tumors. Hum Pathol 23:601-602, 1992
- Hopf NJ, Bremm J, Bohl J, et al: Image analysis of proliferating cells in tumors of the human nervous system: An immunohistological study with the monoclonal antibody Ki-67. Neurosurgery 35:917-923, 1994
- Hoshino T: A commentary on the biology and growth kinetics of low-grade and high-grade gliomas. J Neurosurg 61:895-900, 1984
- Hoshino T: Cell kinetics of glial tumors. Rev Neurol (Paris) 148:396-401, 1992
- Hoshino T, Ahn D, Prados MD, et al: Prognostic significance of the proliferative potential of intracranial gliomas measured by bromodeoxyuridine labeling. Int J Cancer 53:550-555, 1993
- Hoshino T, Nagashima T, Cho YG, et al: S-phase fraction of human brain tumors in situ measured by uptake of bromodeoxyuridine. Int J Cancer 38:369-374, 1986
- Hoshino T, Rodriguez LA, Cho KG, et al: Prognostic implications of the proliferative potential of low-grade astrocytomas. J Neurosurg 69:839-842, 1988
- Hoshino T, Townsend JJ, Muraoka I, et al: An autoradiographic study of human gliomas: Growth kinetics of anaplastic astrocytoma and glioblastoma multiforme. Brain 103:967-984, 1980
- Hoshino T, Wilson CB: Cell kinetic analyses of human malignant brain tumors (gliomas). Cancer 44:956-962, 1979
- Hoyt J, Gown A, Kim D, et al: Analysis of proliferative grade in glial neoplasms using antibodies to the Ki-67 defined antigen and PCNA in formalin fixed, deparaffinized tissues. J Neurooncol 24:163-169, 1995
- Ito S, Chandler KL, Prados MD, et al: Proliferative potential and prognostic evaluation of low-grade astrocytomas. J Neurooncol 19:1-9, 1994
- Ito S, Hoshino T, Shibuya M, et al: Proliferative characteristics of juvenile pilocytic astrocytomas determined by bromodeoxyuridine labeling. Neurosurgery 31:413-419, 1992
- Karamitopoulou E, Perentes E, Diamantis I, et al: Ki-67 immunoreactivity in human central nervous system tumors: A study with MIB 1 monoclonal antibody on archival material. Acta Neurolpathol (Berl) 87:47-54, 1994
- Karkavelas G, Mavropoulou S, Fountzilas G, et al: Correlation of proliferating cell nuclear antigen assessment, histological parameters and age with survival in patients with glioblastoma multiforme. Anticancer Res 15:531-536, 1995
- Kernohan JW, Mabon RF, Svien HJ, et al: A simplified classification of the gliomas. Proc Staff Meetings Mayo Clin 24:71-75, 1949
- Kharbanda K, Dinda AK, Sarkar C, et al: A correlative study of in vivo and in vitro labeling index using bromodeoxyuridine in human brain tumors. J Neurooncol 23:185-190, 1995
- Kleihues P, Burger PC, Scheithauer BW: Histological typing of tumors of the central nervous system, in Kleihues P, Burger PC, Scheithauer BW (eds): International Histological Classification of Tumours. Geneva, Switzerland: World Health Organization, 1995.
- Kros JM, Hop WC, Godschalk JJ, et al: Prognostic value of the proliferation-related antigen Ki-67 in oligodendrogliomas. Cancer 78:1107-1113, 1996
- Kros JM, Van Eden CG, Stefanko SZ, et al: Prognostic implications of glial fibrillary acidic protein containing cell types in oligodendrogliomas. Cancer 66:1204-1212, 1990
- Kunishio K, Mishima N, Matsuhisa T, et al: Immunohistochemical demonstration of DNA polymerase in human brain-tumor cells. J Neurosurg 72:268-272, 1990
- Labrousse F, Daumas-Duport C, Batorski L, et al: Histological grading and bromodeoxyuridine labeling index of astrocytomas. Comparative study in a series of 60 cases. J Neurosurg 75:202-205, 1991
- Louis DN, Edgerton S, Thor AD, et al: Proliferating cell nuclear antigen and Ki-67 immunohistochemistry in brain tumors: A comparative study. Acta Neuropathol (Berl) 81:675-679, 1991
- Maier H, Morimura T, Öfner D, et al: Argyrophilic nucleolar organizer region proteins (Ag-NORs) in human brain tumors: Relations with grade of malignancy and proliferation indices. Acta Neuropathol (Berl) 80:156-162, 1990
- Montine TJ, Vandersteenhoven JJ, Aguzzi A, et al: Prognostic significance of Ki-67 proliferation index in supratentorial fibrillary astrocytic neoplasms. Neurosurgery 34:674-679, 1994
- Morimura T, Kitz K, Budka H: In situ analysis of cell kinetics in human brain tumors. A comparative immunocytochemical study of S phase by a new in vitro bromodeoxyuridine-labeling technique, and of proliferating pool cells by monoclonal antibody Ki-67. Acta Neuropathol (Berl) 77:276-282, 1989
- Mork SJ, Halvorsen TB, Lindegaard K-F, et al: Oligodendroglioma. Histologic evaluation and prognosis. J Neuropathol Exp Neurol 45:65-78, 1986
- Nicoll JA, Candy E: Nucleolar organizer regions and post-operative survival in glioblastoma multiforme. Neuropathol Appl Neurobiol 17:17-20, 1991
- Nishizaki T, Orita T, Furutani Y, et al: Flow-cytometric DNA analysis and immunohistochemical measurement of Ki-67 and BUdR labeling indices in human brain tumors. J Neurosurg 70:379-384, 1989
- Onda K, Davis R, Wilson C, et al: Regional differences in bromodeoxyuridine uptake, expression of Ki-67 protein, and nucleolar organizer region counts in glioblastoma multiforme. Acta Neuropathol (Berl) 87:586-593, 1991
- Onda K, Davis RL, Shibuya M, et al: Correlation between the bromodeoxyuridine labeling index and the MIB-1 and Ki-67 proliferating cell indices in cerebral gliomas. Cancer 74:1921-1926, 1994
- Ostertag CB, Volk B, Shibata T, et al: The monoclonal antibody Ki-67 as a marker for proliferating cells in stereotactic biopsies of brain tumours. Acta Neurochir (Wien) 89:117-121, 1987
- Parkins CS, Darling JL, Gill SS, et al: Cell proliferation in serial biopsies through human malignant brain tumours: Measurement using Ki67 antibody labeling. Br J Neurosurg 5:289-298, 1991
- Patsouris E, Stocker U, Kallmeyer V, et al: Relationship between Ki-67 positive cells, growth rate and histological type of human intracranial tumors. Anticancer Res 8:537-544, 1988
- Pedal WP, Warzok RW, Hufnagl P, et al: Location of nucleolar organizer regions (AgNORs) in the nuclei of astrocytic tumors. Clin Neuropathol 14:55-61, 1995
- Pigott TJ, Lowe JS, Palmer J: Statistical modelling in analysis of prognosis in glioblastoma multiforme: A study of clinical variables and Ki-67 index. Br J Neurosurg 5:61-66, 1991
- Plate KH, Rüschoff J, Behnke J, et al: Proliferative potential of human brain tumours as assessed by nucleolar organizer regions (AgNORs) and Ki67-immunoreactivity. Acta Neurochir (Wien) 104:103-109, 1990
- Plate KH, Rüschoff J, Mennel HD: Cell proliferation in intracranial tumours: Selective silver staining of nucleolar organizer regions (AgNor’s). Application of surgical and experimental neuro-oncology. Neuropathol Appl Neurobiol 17:121-132, 1991
- Prayson R, Khajavi K, Comair Y: Cortical architectural abnormalities and MIB-1 immunoreactivity in gangliogliomas: A study of 60 patients with intracranial tumors. J Neuropathol Exp Neurol 54:513-520, 1995
- Ringertz N: “Grading” of gliomas. Acta Pathol Microbiol Scand 27:51-64, 1950
- Ritter A, Sawaya R, Hess K, et al: Prognostic significance of bromodeoxyuridine labeling in primary and recurrent glioblastoma multiforme. Neurosurgery 35:192-198, 1994
- Sallinen P, Haapasalo H, Kerttula T, et al: Sources of variation in the assessment of cell proliferation using proliferating cell nuclear antigen immunohistochemistry. Anal Quan Cytol Histol 16:261-268, 1994
- Sallinen PK, Haapasalo HK, Visakorpi T, et al: Prognostication of astrocytoma patient survival by Ki-67 (MIB-1), PCNA, and S-phase fraction using archival paraffin-embedded samples. J Pathol 174:275-282, 1994
- Salmon I, Kiss R: Relationship between proliferative activity and ploidy level in a series of 530 human brain tumors, including astrocytomas, meningiomas, schwannomas, and metastases. Hum Pathol 24:329-335, 1993
- Sasaki A, Naganuma H, Kimura R, et al: Proliferating cell nuclear antigen (PCNA) immunostaining as an alternative to bromodeoxyuridine (BrdU) immunostaining for brain tumours in paraffin embedded sections. Acta Neurochir (Wien) 117:178-181, 1992
- Sasaki K, Matsumura K, Tsuji T, et al: Relationship between labeling indices of Ki-67 and BrdUrd in human malignant tumors.Cancer 62:989-993, 1988
- Sasaki K, Murakami T, Kawasaki M, et al: The cell cycle associated change of the Ki-67 reactive nuclear antigen expression. J Cell Physiol 133:579-584, 1987
- Schröder R, Bien K, Kott R, et al: The relationship between Ki-67 labeling and mitotic index in gliomas and meningiomas: Demonstration of the variability of the intermitotic cycle time. Acta Neuropathol (Berl) 82:389-394, 1991
- Shibata T, Burger PC: The use of the monoclonal antibody Ki-67 in determination of the growth fraction in pediatric brain tumors.Childs Nerv Syst 3:364-367, 1987
- Shibata T, Burger PC, Kleihues P: Ki-67 immunoperoxidase stain as marker for the histological grading of nervous system tumours. Acta Neurochir Suppl (Wien) 43:103-106, 1988
- Shibuya M, Ito S, Miwa T, et al: Proliferative potential of brain tumors. Analyses with Ki-67 and anti-DNA polymerase alpha monoclonal antibodies, bromodeoxyuridine labeling, and nuclear organizer region counts. Cancer 71:199-206, 1993
- Shibuya M, Miwa T, Hoshino T: Embedding and fixation techniques for immunohistochemical staining with anti-DNA polymerase and Ki-67 monoclonal antibodies to analyze the proliferative potential of tumors. Biotech Histochem 67:161-164, 1992
- Simpson J, Page D: Cellular proliferation and prognosis in breast cancer: Statistical purity versus clinical utility. Hum Pathol 25:331-332, 1994
- Smith MT, Ludwig CL, Godfrey AD, et al: Grading of oligodendrogliomas. Cancer 52:2107-2114, 1983
- Spaar FW, Ahyai A, Spaar U, et al: Flow-cytophotometry of nuclear DNA in biopsies of 45 human gliomas and after primary culture in vitro. Clin Neuropathol 5:157-175, 1986
- Sugawara I, Uchino K, Morishita Y, et al: Intracellular localisation of a subunit of human DNA polymerase alpha affecting primase activity recognised by monoclonal antibody (HDR-854-E4) and its application to distinction between proliferative and non-proliferative lesions. Br J Cancer 60:176-181, 1989
- Svien HJ, Mabon RF, Kernohan JW, et al: Astrocytomas. Proc Staff Meetings Mayo Clin 24:54-63, 1949
- Tabuchi K, Honda C, Nakane PK: Demonstration of proliferating cell nuclear antigen (PCNA/cyclin) in glioma cells. Neurol Med Chir (Tokyo) 27:1-5, 1987
- Theunissen PH, Blaauw G: Proliferating cell nuclear antigen immunostaining and survival in cerebral astrocytoma.Histopathology 23:75-79, 1993
- Vaquero J, Martinez R, Arias A, et al: A rapid intraoperative estimation of the proliferative activity in brain tumors. Histol Histopathol 6:435-438, 1991
- Verheijen R, Kuijpers HJ, Schlingemann RO, et al: Ki-67 detects a nuclear matrix-associated proliferation-related antigen. I. Intracellular localization during interphase. J Cell Sci 92:123-130, 1989
- Vigliani MC, Chiò A, Pezzulo T, et al: Proliferating cell nuclear antigen (PCNA) in low-grade astrocytomas: Its prognostic significance. Tumori 80:295-300, 1994
- Wacker MR, Hoshino T, Ahn DK, et al: The prognostic implications of histologic classification and bromodeoxyuridine labeling index of mixed gliomas. J Neurooncol 19:113-122, 1994
- Wakimoto H, Aoyagi M, Nakayama T, et al: Prognostic significance of Ki-67 labeling indices obtained using MIB-1 monoclonal antibody in patients with supratentorial astrocytomas. Cancer 77:373-380, 1996
- Waseem NH, Lane DP: Monoclonal antibody analysis of the proliferating cell nuclear antigen (PCNA). Structural conservation and the detection of a nucleolar form. J Cell Sci 96:121-129, 1990
- Weidner N, Moore DH 2nd, Vartanian R: Correlation of Ki-67 antigen expression with mitotic figure index and tumor grade in breast carcinomas using the novel “paraffin”-reactive MIB1 antibody. Hum Pathol 25:337-342, 1994
- Zaprianov Z, Christov K: Histological grading, DNA content, cell proliferation and survival of patients with astroglial tumors.Cytometry 9:380-386, 1988