
CT Perfusion Imaging
Matthew T. Walker, MD*
Sandeep Deshmukh, MD
Deborah L. Harbison, MPH
Shahram Partovi, MD
Division of Neuroradiology, Barrow Neurological Institute, St. Joseph’s Hospital and Medical Center, Phoenix, Arizona
*Current Address: Division of Neuroradiology, Northwestern Memorial Hospital, Chicago, Illinois
Abstract
Computed tomography (CT) perfusion is a new imaging modality that permits the microcirculation of the brain to be evaluated. Unlike conventional CT imaging, which assesses brain structure and morphology, CT perfusion gathers physiologic information about the status of the cerebral perfusion. CT perfusion imaging has the potential to markedly affect the initial evaluation of patients with acute cerebral infarction by helping to identify the ischemic penumbra. Whereas diffusion magnetic resonance imaging can identify dead brain tissue, CT perfusion imaging can help identify dying brain tissue—tissue that may recover with prompt and appropriate therapy. Other work has demonstrated potential uses of CT perfusion imaging in evaluating and following cranial and extracranial steno-occlusive disease, in assessing vasospasm after subarachnoid hemorrhage, in distinguishing neoplasms from infections, and in confirming brain death.
Key Words: cerebral perfusion, computed tomography (CT) perfusion imaging, infections, magnetic resonance perfusion imaging, microcirculation, moya moya disease, neoplasms, positron emission tomography, single photon emission CT, steno-occlusive disease, stroke, xenon CT
Advances in computed tomography (CT) such as slip-ring technology and multidetector helical systems have resulted in subsecond scanning and thereby greatly expanded the role of CT in contemporary diagnostic imaging. CT perfusion and CT angiography are two examples of advanced CT applications now available as a result of these improvements. This article provides an overview of CT perfusion and its clinical applications: acute stroke, chronic steno-occlusive disease, vasospasm, brain death, brain tumor, and other neuropsychiatric disorders. Strategies to assess cerebral perfusion are described with specific reference to CT perfusion, positron emission tomography (PET), magnetic resonance (MR) perfusion, xenon CT, and single photon emission CT (SPECT).
Anatomy
The intracranial neurovascular system can be divided into the macrocirculation and the microcirculation. The macrocirculation consists of the larger proximal vessels that are visible on anatomic imaging studies such as digital subtraction angiography (DSA), MR angiography, and CT angiography. The circle of Willis, including the anterior and posterior circulation, is exceptionally well delineated with these techniques. DSA is the gold standard for evaluating the macrocirculation. CT angiography and MR angiography are complementary macrovascular imaging studies with their own strengths and weaknesses. All three modalities provide anatomic detail but fail to provide a sophisticated method for evaluating brain parenchymal perfusion. The microcirculation consists of arterioles and the intervening capillary bed and venules embedded in brain tissue, which are the sites of oxygen extraction. The microcirculation is not visible on routine anatomic studies and must be evaluated with cerebral perfusion techniques such as CT perfusion, PET, MR perfusion, xenon CT, and SPECT.
Physiology and Pathophysiology of Cerebral Perfusion
Autoregulation is the process by which the brain maintains almost constant cerebral blood flow (CBF, ml/100 gm/min) in the presence of fluctuations in cerebral perfusion pressure (CPP, mm Hg).[28] Little change in CBF is observed over a broad range of CPP (50 to 130 mm Hg) because of the ability of precapillary resistance to adjust in response.[11,20] When CPP increases above 140 mm Hg, vasoconstriction becomes maximal and CBF increases dramatically.[14] When CPP decreases below 40 mm Hg, vasodilation becomes maximal and CBF diminishes linearly. This autoregulatory vasodilation is known as Stage 1 hemodynamic compromise.[27] As CPP decreases further, the ability to vasodilate is lost and CBF decreases. The brain compensates by increasing the extraction of oxygen from the blood to maintain the cerebral metabolism of oxygen.[11,22] Stage 2 hemodynamic failure or misery perfusion is characterized by decreased CBF and increased oxygen extraction.[20,36] As CPP diminishes further, oxygen metabolism is disrupted causing cellular dysfunction and eventually cell death.
The normal range of CBF has been established by PET and varies widely (45 to 110 ml/100 g/min).[31] The range of CBF in the setting of acute stroke has been stratified in an attempt to identify potentially recoverable tissue. Typically, CBF values below 10 ml/100 g/min indicate infarction whereas values between 10 and 22 ml/100 g/min identify tissue that is ischemic but not yet infarcted. The latter range is referred to as the ischemic penumbra.[7,15] CBF values between 23 and 44 ml/100 g/min represent oligemic tissue. Autoregulatory control can result in normal CBF in the setting of decreased CPP. Moreover, when the metabolic demands of the brain are low, CBF values can decrease even though CPP is normal.
As a single hemodynamic parameter, CBF is insufficient to assess perfusion status. Other hemodynamic parameters such as cerebral blood volume (CBV, ml/100 g) and mean transit time (MTT, secs) have been investigated in an attempt to elucidate microcirculatory perfusion. The relationship of these three parameters is reflected by the central volume principle, which states that MTT=CBV/CBF.
Overview of Perfusion Techniques
The five perfusion techniques provide a qualitative assessment of CBF and are based on either the diffusible tracer model (i.e., PET, SPECT, and xenon CT) or the tracer kinetic model (i.e., CT perfusion, MR perfusion). Qualitative measurements are useful in unilateral disease but are inadequate with bilateral or global pathology. The gold standard for the quantitative assessment of hemodynamic parameters is PET.[26] Financial constraints and limited availability, however, have restricted the availability of PET and have led to reliance on other technologies.
Validation studies have shown that xenon CT is a reliable method of assessing cerebral perfusion and of determining CBF.[10] Xenon is an inert gas that freely diffuses from the vascular compartment and across the blood-brain barrier. The distribution of xenon depends on CBF and relies on the change in Hounsfield units over time. Calculations of blood flow are displayed as color maps, and regions of interest (ROIs) are placed in the different vascular territories as estimates of CBF. The major disadvantage of xenon CT is its high sensitivity to motion artifact because acquisition time is lengthy (6 min). Moreover, xenon can make patients feel nauseous or dizzy thus decreasing compliance.
SPECT imaging provides a semiquantitative assessment of cerebral perfusion.[8] SPECT also relies on the diffusible tracer model and requires the use of a radionuclide such as 99mTc-hexylmethylpropyleneamine oxime. The correlation of measured CBF to actual CBF is unclear. Thus, the usefulness of SPECT for assessing cerebral hemodynamic factors is limited. Technical factors, availability, and cost also limit the utility of SPECT for assessing cerebral hemodynamic factors.
MR perfusion is a qualitative technique that follows the tracer kinetic model and takes advantage of the T2* susceptibility effects of gadolinium.[25] This first-pass model assumes that the tracer is neither metabolized nor absorbed and relies on factors such as the amount and rate of the bolus injection and systemic hemodynamic parameters. The most commonly used exogenous tracer in clinical practice is gadolinium. Because MR perfusion maps are qualitative representations of the data, a lower case r, signifying relative, is used to identify it as such (e.g., rCBF). Theoretically, quantitative measurements of cerebral hemodynamics are possible but significantly hampered by the identification of an arterial input function. Endogenous contrast agents such as magnetically labeled spins (spin-labeling) assume the diffusible tracer model but remain a research tool.
Much like MR perfusion, CT perfusion follows the tracer kinetic model and provides qualitative data that can be deconvolved mathematically into semiquantitative parameters of cerebral perfusion. Unlike MR perfusion, the arterial input function is identified reliably, an essential attribute if the quantitative data are to be believed. Quantitative measurements have been assessed in animals and are promising.[24] More recently, CT perfusion quantitative values were compared to xenon CT and the results were favorable.[37]
Imaging Strategies
There are two basic strategies for evaluating Stage 1 hemodynamic compromise (autoregulatory vasodilation). The first strategy uses mathematical techniques to quantify or semiquantify cerebral perfusion parameters such as CBF, CBV, and MTT, which are compared with the contralateral hemisphere or known standard values. The second strategy uses paired blood flow studies with perfusion parameters measured before and after a vasodilator challenge. Examples of vasodilator challenges include acetazolamide, hypercapnia, and physiologic tasks such as hand movements. A third strategy directly measures oxygen extraction and is an assessment of Stage 2 hemodynamic failure. To date, only PET can accurately evaluate oxygen extraction.[23]
Application of CT Perfusion
The concept of using dynamic CT to measure CBF is not recent; Axel first investigated the idea in 1980.[1] Since then technology has evolved, and scanning is now faster and data manipulation more robust. Consequently, this technique has migrated from the laboratory to the clinical setting.
CT perfusion is based upon the tracer kinetic model and assumes a nondiffusible tracer. This first-pass technique monitors changes in density as a function of time. ROI or pixel-based time attenuation curves are produced by deconvolution. From these data, quantitative cerebral perfusion maps, including CBF, CBV and MTT, are constructed.
Our institution uses a multidetector (4i) helical CT scanner (General Electric LightSpeed, General Electric Company, Milwaukee, WI) for CT perfusion examinations. A single level that includes portions of the territories of the anterior cerebral artery, middle cerebral artery (MCA), and posterior cerebral artery is selected. A large bore (18 g) antecubital intravenous line is essential, and scan parameters are 80 kV and 200 mA. After a 5-second preparation delay, four 5-mm slices are obtained at 1.25-mm intervals over a 45-second cine acquisition. This protocol yields 180 images while nonionic contrast (40 ml at 300 mg/ml) is injected at a rate of 4 ml/sec. The images are reconstructed into two 10-mm images and are used to calculate CBF, CBV, and MTT. Scan time is less than one minute, and postprocessing requires 5 to 15 minutes depending on the user’s proficiency.
Acute Stroke
Unenhanced CT, which provides morphologic information about brain parenchyma, has long been the cornerstone for evaluating acute stroke. A normal CT scan of the brain and evidence of an acute infarction herald the need for rapid medical therapy and potentially intravascular intervention. In the setting of acute stroke, intravenous thrombolysis is an effective treatment if instituted within 3 hours.[19,29] Intraarterial thrombolysis has a slightly wider window, extending as long as 6 hours. Although vessels can recanalize, the patient may not necessarily improve. Any technique that quickly identifies brain tissue at risk is likely to improve patient care significantly.
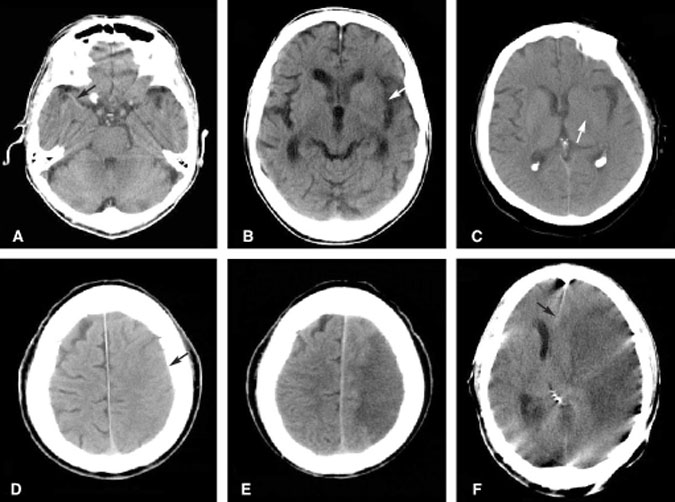
As an acute infarction progresses and cytotoxic edema ensues, the morphology of the brain alters in a predictable fashion (Fig. 1). Considerable research has attempted to identify the risk-benefit ratio of instituting fibrinolytic or anticoagulation therapy given the alterations in brain morphology. For example, if the morphologic changes correspond to a volume greater than one third of the territory of the MCA, then thrombolytic therapy carries a high risk of cerebral hemorrhage.[32] Other authors have criticized the use of morphologic data to infer physiologic events occurring during an acute infarction. Indeed, some have argued that instead of observing morphologic alterations to identify the segments of the brain that have already died, the goal should be to identify the segments at risk of dying–the so-called ischemic penumbra. This area cannot be identified on conventional unenhanced CT scans of the brain.
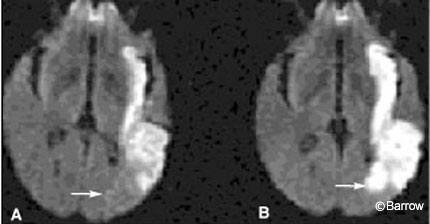
Some authors have advocated the use of diffusion MR imaging to evaluate acute infarctions. Diffusion MR imaging approaches physiologic imaging more than conventional CT. It identifies cytotoxic edema, the hallmark of failure of the Na+/K+ ion pump, and cell death (Fig. 2). Hence, diffusion MR imaging also identifies portions of brain parenchyma that have already succumbed to ischemia and died rather than the volume of dying tissue in the ischemic penumbra. Identifying the volume of dead brain tissue has important prognostic value, but identifying the volume of potentially salvageable brain tissue could influence the course and aggressiveness of acute therapy even more. To identify the ischemic penumbra, some form of perfusion imaging is required.
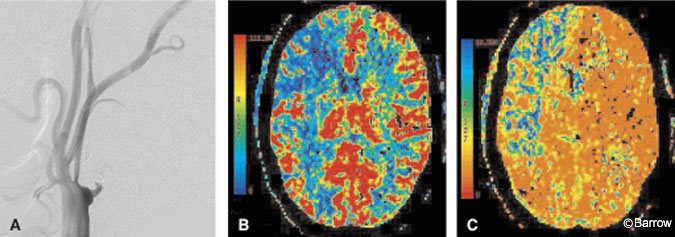
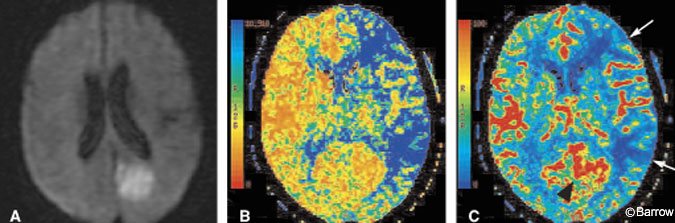
CT perfusion can be performed quickly, safely, and in the same scanner as used for the noncontrast head CT. CT perfusion can show the effects of large vessel occlusion, including decreased CBF and CBV and delayed MTT (Fig. 3).[18] MTT is the parameter best associated with identifying the volume of brain at risk (ischemic penumbra) in an acute infarction. As transit time prolongs, the slow flow of blood results in greater and greater extraction of oxygen. Once oxygen extraction reaches a maximum, further demand causes hypoxemia, ion pump failure, and eventual cell death. Recent work with perfusion imaging suggests that CBF and MTT tend to overestimate the final extent of injury.[16,30] These observations suggest that CBF or MTT could help distinguish the volume of dying brain from that of already infarcted brain which correlates more closely with CBV (Fig. 4). A noteworthy pitfall of CT (or MR) perfusion imaging is the paradoxical increase in CBF that can occur in an infarcted territory. Such an increase reflects a state of “luxury perfusion” and is accompanied by a commensurate decrease in MTT (Fig. 4).
Given the ability to peer into the cellular physiology of an infarcting brain, future work may identify new quantitative parameters that can serve as tools for selecting treatment paradigms. Identifying the volume of brain tissue at risk may alter the course of treatment, irrespective of the time elapsed from stroke onset–a parameter whose identification is tenuous at best.
Illustrative Case 1
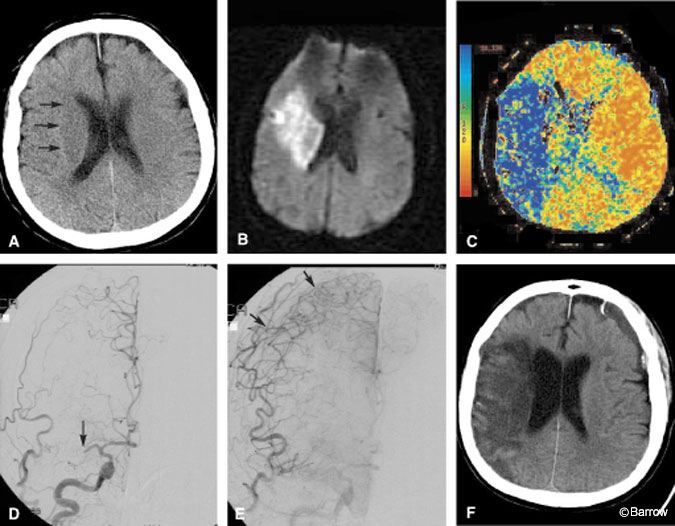
A 68-year-old woman presented to the emergency department with clinical findings of an acute right hemispheric infarction more than 8 hours after the onset of her symptoms. Two months earlier she had sought treatment in the emergency department for transient ischemic attack (TIA)-like symptoms. At that time, CT of the brain was normal (Fig. 5A) and she was placed on medical therapy. On this admission, CT and MR imaging identified a moderate-sized infarction in the right basal ganglia (Fig. 5B). MR angiography showed that the right MCA was occluded. In contrast to the known volume of infarction identified on diffusion MR imaging, a CT perfusion study was performed to identify the potential volume of brain at risk of infarction. The MTT image of the CT perfusion study suggested a large volume of brain tissue at risk in the right hemisphere where transit time was markedly prolonged (Fig. 5C). DSA was performed to confirm that the MCA was occluded and to assess the collateral macrocirculation (Fig. 5D). Angiography identified some leptomeningeal collateral circulation to the right hemisphere (Fig. 5E). Despite aggressive medical therapy aimed at salvaging this ischemic penumbra, the territory infarcted completely and was malacotic on follow-up CT (Fig. 5F).
Prolonged MTT in any patient with brain ischemia should be a significant concern. As blood transit slows, oxygen extraction increases to match the demand. Without resolution of the blood flow obstruction or the recruitment of adequate collaterals, demand eventually outstrips supply and infarction ensues. In this patient, CT perfusion imaging identified that problem to be more serious than suggested by her immediately preceding MR image. The CT perfusion study not only influenced treatment strategy but also had prognostic implications. Although endovascular intervention was discussed during angiography, this patient was not considered to fall within established treatment options despite the large ischemic penumbra identified by CT perfusion imaging. As CT perfusion gains wider acceptance, classic treatment groups may have to be re-evaluated and defined to a greater extent according to physiologic data such as that provided by CT perfusion than by the more generic parameter, time from ictus.
Chronic Steno-Occlusive Disease
Symptomatic extracranial carotid stenosis is a common condition that can be treated effectively with endarterectomy. Extracranial carotid occlusion and symptomatic intracranial atherosclerotic disease represent a complex subgroup of patients with few proven therapeutic options. Cerebral perfusion in patients with chronic vascular disease is affected by many factors including whether the patient has a complete circle of Willis; the status of collateral recruitment; and the presence of multiple, tandem, or bilateral lesions. Moreover, the metabolic demand of the brain can vary greatly, resulting in patients who are asymptomatic at rest but who develop symptoms with activity.
Undoubtedly at presentation, many patients with progressive steno-occlusive disease are in Stage 1 hemodynamic compromise with autoregulatory vasodilation and possibly in Stage 2 compromise where oxygen extraction is already increased.[4] CT perfusion is an effective tool for evaluating cerebral perfusion in these patients. CT perfusion can qualitatively assess the symmetry of perfusion and quantify cerebral perfusion parameters. CBF and CBV can be almost normal in these patients, but MTT tends to be prolonged on the ipsilateral side.
Cerebrovascular reserve reflects the status of autoregulatory control and is an important component of an evaluation for a bypass. Reserve capacity is evaluated by pre- and postvasodilation challenge perfusion studies. Xenon CT has been used in this way with acetazolamide as the vasodilator challenge. Response is categorized into one of three grades: less than expected augmentation relative to the contralateral side (Grade 1), absent augmentation (Grade 2), and paradoxical reduction in flow or the steal phenomena (Grade 3). The stroke rate of symptomatic patients with a Grade 3 response is 30%.[34] These results are similar to the observations found in PET studies. Based on xenon imaging, patients with a Grade 2 or 3 response can undergo bypass surgery. Whether CT perfusion can replace xenon or PET in this regard remains to be answered. We have observed similar results between CT perfusion and xenon imaging in patients undergoing an acetazolamide challenge (Fig. 6). A double-blind study is underway to draw more conclusive statistical inferences from these observations.
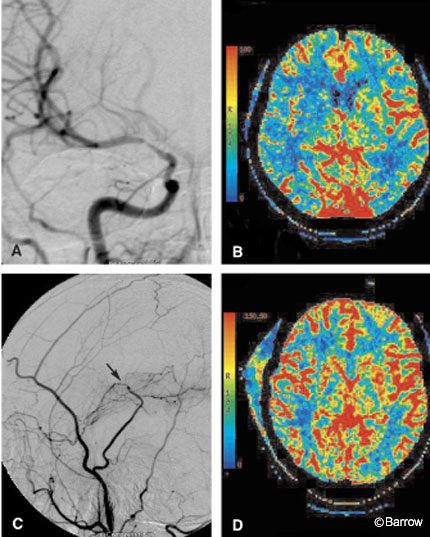
Patients who have undergone extracranial-to-intracranial bypass surgery can be evaluated postoperatively and even followed with CT perfusion imaging. Anatomic studies may show an anastomosis to be patent and can provide a sense of perfusion, but they cannot quantify perfusion parameters. CT perfusion, however, can assess whether MTT is prolonged, which may suggest a relative mechanical delay of blood flow (Fig. 7). The status of collateral circulation, such as delayed MTT but normal CBF and CBV values, also can be inferred. Further work in this area is needed to clarify the role of CT perfusion imaging in the postoperative evaluation of extracranial-intracranial bypass patients.
A final subset of patients with steno-occlusive disease who may benefit from CT perfusion are those with progressive, proximal stenosis of a large vessel leading to occlusion. In children this condition is referred to as moyamoya disease. The status of cerebral perfusion could as easily be assessed with CT perfusion as it is with xenon CT. CT perfusion could become a valuable tool in the preoperative assessment and postoperative follow-up of these patients.
Illustrative Case 2
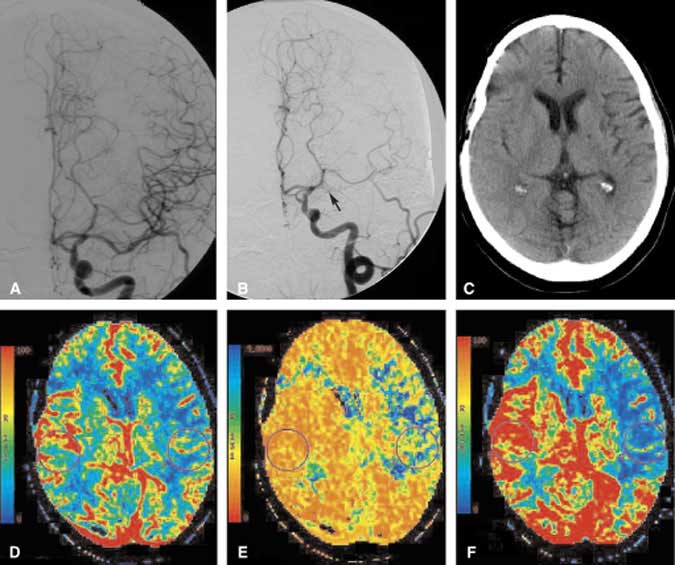
A 34-year-old woman sought treatment for recurrent symptoms of right hemispheric TIAs. Initial MR and MR angiography suggested moderate-to-severe stenosis of the right MCA without evidence of acute or chronic cortical infarction. A DSA confirmed stenosis of the right MCA (Fig. 7A), and medical therapy was instituted. During the next few weeks her symptoms continued to recur, and the patient was referred for possible endovascular therapy. Angioplasty of the right MCA was unsuccessful. Follow-up DSA showed continued severe stenosis and the patient’s symptoms persisted. She was referred to the neurosurgical team for a possible superficial temporal artery (STA)-to-MCA bypass. CT perfusion imaging was performed to assess the microcirculation of the right hemisphere. A CBF image of the CT perfusion study confirmed the reduction in blood flow to the right hemisphere (Fig. 7B). The MTT image (not shown) revealed prolonged transit time. Given the patient’s persistent symptoms and the physiologic confirmation of altered blood flow in the right hemisphere, she elected to proceed with the STA-MCA bypass. Postoperative angiography identified the anastomotic site to be widely patent with excellent contrast blush in the parenchyma of the right temporal lobe (Fig. 7C). CBF in the right hemisphere had improved markedly on her postoperative CT perfusion study (Fig. 7D). The MTT image (not shown) also was almost symmetric. Clinically, this patient improved after the bypass procedure.
Classically, the pre- and postoperative vascular assessment of patients undergoing STA-MCA bypass included evaluation of the macrocirculation. DSA is performed not only to assess the blood supply to the area of interest but to evaluate the patency of the bypass. CT perfusion imaging permits the hemispheric microcirculation to be evaluated both pre- and postoperatively. Preoperatively, this patient’s right MCA stenosis was not accompanied by a well-developed network of microcollaterals, and overall perfusion to the right hemisphere decreased. In this case, CT perfusion imaging confirmed that the right hemisphere was at some risk for ischemia. Postoperative CT perfusion imaging helped to confirm objectively that the procedure significantly improved the microcirculation in the affected hemisphere.
Vasospasm
The risk of vasospasm after subarachnoid hemorrhage (SAH) is greatest 5 to 10 days after the first episode. As many as 20 to 30% of patients with SAH develop symptomatic vasospasm.17 Factors that correlate with a patient’s potential response to vasospasm include amount of SAH, CPP, hematocrit level, and collateral blood supply.[6] While transcranial Doppler ultrasonography is a noninvasive bedside test used to monitor vasospasm, it is operator-dependent and results can vary. In addition, coverage of the macrocirculation is limited and microcirculation perfusion data are not provided. The gold standard used to investigate vasospasm is DSA, and in some institutions perfusion data are obtained with xenon CT. CT perfusion imaging also can be used to assess hemodynamic changes related to vasospasm, including changes in CBF, CBV, and MTT (Fig. 8). After SAH, patients may experience changes in mental status associated with abnormal findings on transcranial Doppler ultrasonography but a normal examination on DSA. Such patients may benefit from a CT perfusion study that assesses the status of the microcirculation. CT perfusion also can be used to assess the response to vasospasm therapy, including hemodilution-hypertensive-hypervolemia, vasodilators, and angioplasty.
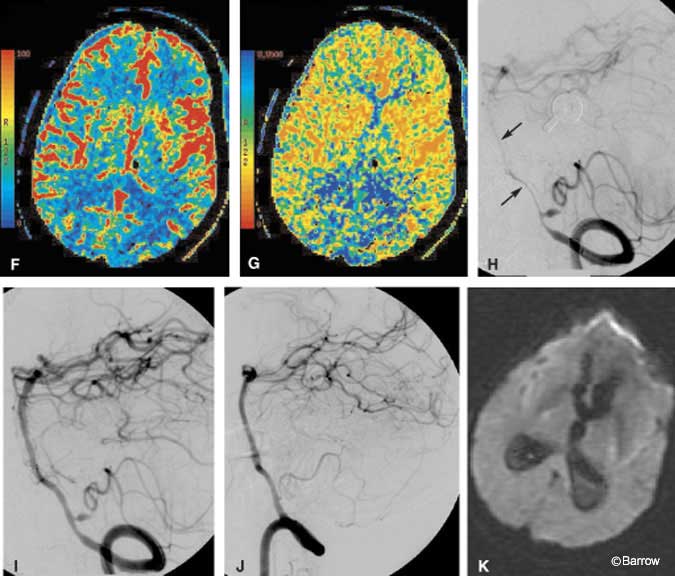
Illustrative Case 3
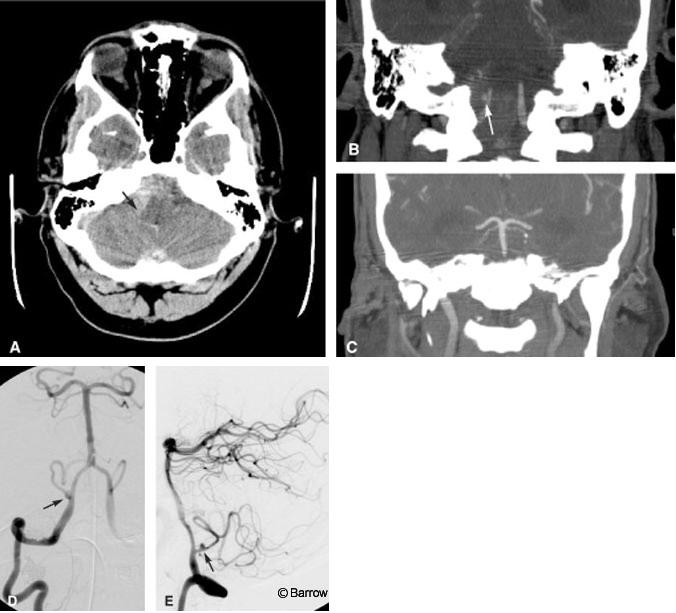
A 41-year-old male was brought to the emergency department after he was found obtunded at home. The initial CT study of the brain showed a marked amount of SAH with its epicenter in the right posterior fossa (Fig. 8A). Emergent CT angiography (sagittal and coronal multiplanar reconstructions) performed at the same time as the initial head CT identified an aneurysm on the right posterior inferior cerebellar artery (PICA, Fig. 8B). No evidence for basilar artery vasospasm was seen on the admission CT angiogram (Fig. 8C). Immediately thereafter, DSA showed the location of the PICA aneurysm slightly better than the CT angiogram (Fig. 8D and E), clarifying that aneurysm was about 5 mm distal to the orgin of the PICA, a typical location. No substantial posterior communicating arteries were visible on either CT angiography or DSA (not shown). The patient underwent surgical clipping the same day without complications. On postoperative Day 6, a rapid change in his clinical status suggested vasospasm. The CBF image of a CT perfusion study showed a marked decrease in blood flow to both occipital lobes (Fig. 8F). As expected, the MTT image showed a commensurate marked delay in blood transit through the same territories (Fig. 8G). Basilar artery vasospasm was diagnosed presumptively. The patient was moved directly to the interventional suite where pretreatment DSA confirmed severe basilar artery vasospasm (Fig. 8H). A small residual aneurysm on the PICA also was identified. Percutaneous angioplasty of the basilar artery was then performed. Posttreatment images showed markedly improved blood flow throughout the basilar artery (Fig. 8I). The residual aneurysm was occluded with coils during a subsequent interventional session without complications (Fig. 8J). Follow-up MR diffusion imaging failed to show evidence of infarction in the occipital lobes despite the earlier reduction in CBF (Fig. 8K).
In this case, CT perfusion imaging helped to identify the volume of brain tissue at risk of dying but not yet infarcted. This acute physiologic information was key because it expedited the patient’s move from CT directly to the interventional suite for immediate treatment. The potentially devastating consequence of bilateral cortical blindness was thus avoided. Follow-up clinical examination and diffusion MR imaging confirmed that cortical infarctions were avoided
Brain Death
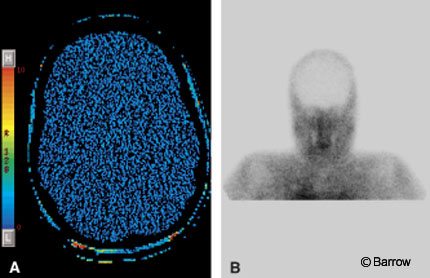
In the United States, a declaration of brain death does not need to be documented with a CBF study.[35] Confirmatory blood flow studies, however, are often ordered for pediatric patients. In the past, nuclear medicine studies, DSA, and transcranial Doppler ultrasonography have been used to confirm the lack of blood flow to the brain. CT perfusion imaging can confirm changes in CBF and also can provide information about CBV and MTT. We have used CT perfusion to confirm brain death in one patient (Fig. 9). As the use of CT perfusion imaging increases, it may become a helpful adjunct in this clinical scenario.
Brain Tumors
Neovascularity and the break down of the blood-brain barrier are hallmarks of brain tumors and the cornerstones of perfusion imaging. Most of the literature regarding perfusion imaging of brain tumors describes the use of PET and MR perfusion techniques.[21] PET relies on the uptake and metabolism of glucose whereas MR perfusion analyzes CBV. The success of these techniques in distinguishing high-grade gliomas from low-grade gliomas and radiation necrosis from recurrent tumor has varied. Eventually, these techniques may help target lesions for stereotactic biopsy to increase the yield of potentially malignant cells, and they may help assess the therapeutic effectiveness of chemotherapy. CT perfusion imaging can provide information similar to that provided by MR perfusion and may become a complementary examination for the evaluation of brain tumors. More work is needed to validate the efficacy of CT perfusion techniques for imaging brain tumors.
Infection
Distinguishing between toxoplasmosis and lymphoma can be challenging. In one study of 13 patients, perfusion imaging showed decreased CBV in all proven toxoplasmotic lesions and increased CBV in all active lymphoma cases.[5] These changes in CBV could be a powerful tool for making this differential diagnosis. In other early work, purely cystic brain tumors and abscesses were examined with MR perfusion imaging. Preliminary findings suggest that the capsule of cystic tumors increased vascularity whereas the capsule of an abscess does not.[2] Finally, MR perfusion imaging and PET have shown increases in CBV in patients with human immunodeficiency virus, suggesting the presence of hemodynamic changes in these patients.[9] CT perfusion can provide similar information to that provided by MR perfusion and may prove clinically useful, but validation studies are needed. Whether CT- or MR-based, perfusion imaging is permitting brain parenchymal assessment at a microcirculation level where it was not possible before.
Miscellaneous Disorders
Perfusion imaging has been applied to many other disorders, including dementia, attention deficit hyperactivity disorder, epilepsy, and schizophrenia.[3,12,13,33] The effect of psychoactive drugs, specifically cocaine, also has been investigated.[25] As CT perfusion imaging becomes more widely available, more information about a variety of pathologies can be investigated.
Conclusion
Imaging modalities provide essential information about the structural relationships and morphologic characteristics of normal and abnormal tissue, but they provide little to no detail about underlying physiology. Perfusion imaging techniques provide a glimpse into the physiology of the human brain, especially as it relates to cerebral perfusion parameters. Due to technological advances in CT, CT perfusion imaging is enjoying a renaissance and its efficacy is being validated through research. Clinical situations where CT perfusion may be useful include acute stroke, chronic steno-occlusive disease, vasospasm, brain death, brain tumors, and infection. Until further work is done, CT perfusion will likely have its greatest impact on the evaluation of stroke patients. As more validation studies are published, the scope of the applications of CT perfusion can be expected to expand.
References
- Axel L: Cerebral blood flow determination by rapid-sequence computed tomography: Theoretical analysis. Radiology 137:679-686, 1980
- Cha S, Yang C, Knopp E, et al: Dynamic contrast-enhanced T2-weighted MR imaging of intracranial infections (paper 356). Proceedings of American Society of Neuroradiology, 2001
- Cohen BM, Yurgelun-Todd D, English CD, et al: Abnormalities of regional distribution of cerebral vasculature in schizophrenia detected by dynamic susceptibility contrast MRI. Am J Psychiatry 152:1801-1803, 1995
- Derdeyn CP, Yundt KD, Videen TO, et al: Increased oxygen extraction fraction is associated with prior ischemic events in patients with carotid occlusion. Stroke 29:754-758, 1998
- Ernst TM, Chang L, Witt MD, et al: Cerebral toxoplasmosis and lymphoma in AIDS: Perfusion MR imaging experience in 13 patients. Radiology 208:663-669, 1998
- Fisher CM, Roberson GH, Ojemann RG: Cerebral vasospasm with ruptured saccular aneurysm—the clinical manifestations. Neurosurgery 1:245-248, 1977
- Furlan M, Marchal G, Viader F, et al: Spontaneous neurological recovery after stroke and the fate of the ischemic penumbra. Ann Neurol 40:216-226, 1996
- Goldman H: Techniques for measuring cerebral blood flow, in Phillis JW (ed): The Regulation of Cerebral Blood Flow. Boca Raton, FL: CRC Press, 1993
- Gonzalez RG, Tracey O, Navia B: Functional MR-imaging in HIV-positive subjects: Detection of increased cerebral blood volume in the deep grey matter (paper 346). Proceedings of the 82nd Scientific Assembly and Annual Meeting of the RSNA, 1996
- Gur D, Yonas H, Jackson DL, et al: Simultaneous measurements of cerebral blood flow by the xenon/CT method and the microsphere method: A comparison. Invest Radiol 20:672-677, 1985
- Harper AM: Autoregulation of cerebral blood flow: Influence of the arterial blood pressure on the blood flow through the cerebral cortex. J Neurol Neurosurg Psychiatry 29:398-403, 1966
- Harris GJ, Lewis RF, Satlin A, et al: Dynamic susceptibility contrast MR imaging of regional cerebral blood volume in Alzheimer disease: Promising alternative to nuclear medicine. AJNR Am J Neuroradiol 19:1727-1732, 1998
- Imperio W: Cerebral blood flow differs in adults with ADHD. Clin Psychiatry News 1:10, 2000
- Johnson DW, Stringer WA, Marks MP, et al: Stable xenon CT cerebral blood flow imaging: Rationale for and role in clinical decision making. AJNR Am J Neuroradiol 12:201-213, 1991
- Jones TH, Morawetz RB, Crowell RM, et al: Thresholds of focal cerebral ischemia in awake monkeys. J Neurosurg 54:773-782, 1981
- Karonen JO, Vanninen RL, Liu Y, et al: Combined diffusion and perfusion MRI with correlation to single-photon emission CT in acute ischemic stroke. Ischemic penumbra predicts infarct growth. Stroke 30:1583-1590, 1999
- Kassell NF, Sasaki T, Colohan ART, et al: Cerebral vasospasm following aneurysmal subarachnoid hemorrhage. Stroke 16:562-572, 1985
- Koenig M, Klotz E, Luka B, et al: Perfusion CT of the brain: Diagnostic approach for early detection of ischemic stroke. Radiology 209:85-93, 1998
- Koroshetz WJ, Moskowitz MA: Emerging treatments for stroke in humans. Trends Pharmacol Sci 17:227-233, 1996
- Lassen NA: Cerebral blood flow and oxygen consumption. Physiol Rev 39:183-238, 1959
- Lev M, Rosen B: Clinical applications of intracranial perfusion MR imaging. Neuroimaging Clin N Am 9:309-331, 1999
- Meyer JS, Hata T, Imai A: Clinical and experimental studies of diaschisis, in Wood JH
- Mintun MA, Raichle ME, Martin WR, et al: Brain oxygen utilization measured with O-15 radiotracers and positron emission tomography. J Nucl Med 25:177-187, 1984
- Nabavi DG, Cenic A, Craen RA, et al: CT assessment of cerebral perfusion: Experimental validation and initial clinical experience. Radiology 213:141-149, 1999
- Petrella JR, Provenzale JM: MR perfusion imaging of the brain: Techniques and applications. AJR Am J Radiology 175:207-219, 2000
- Powers WJ, Grubb RL Jr, Darriet D, et al: Cerebral blood flow and cerebral metabolic rate of oxygen requirements for cerebral function and viability in humans. J Cereb Blood Flow Metab 5:600-608, 1985
- Powers WJ, Press GA, Grubb RL, et al: The effect of hemodynamically significant carotid artery disease on the hemodynamic status of the cerebral circulation. Ann Intern Med 106:27-34, 1987
- Rapela CE, Green HD: Autoregulation of canine cerebral blood flow. Circ Res 15 (Suppl):205-211, 1964
- The National Institute for Neurological Disorders and Stroke, rt-PA Stroke Study Group: Tissue plasminogen activator for acute ischemic stroke. N Engl J Med 333:1581-1587, 1995
- Ueda T, Yuh WT, Maley JE, et al: Outcome of acute ischemic lesions evaluated by diffusion and perfusion MR imaging. AJNR Am J Neuroradiol 20:983-989, 1999
- Ueda T, Yuh WTC, Maley JE, et al: Current and future imaging of acute cerebral ischemia: Assessment of tissue viability by perfusion imaging. J Comput Assist Tomogr 23:S3-S7, 1999
- von Kummer R, Allen KL, Holle R, et al: Acute stroke: Usefulness of early CT findings before thrombolytic therapy. Radiology 205:327-333, 1997
- Warach S, Levin JM, Schomer DL, et al: Hyperperfusion of ictal seizure focus demonstrated by MR perfusion imaging. AJNR Am J Neuroradiol 15:965-968, 1994
- Webster MW, Makaroun MS, Steed DL, et al: Compromised cerebral blood flow reactivity is a predictor of stroke in patients with symptomatic carotid artery occlusive disease. J Vasc Surg 21:338-344, 1995
- Wijdicks EF: The diagnosis of brain death. N Engl J Med 344:1215-1221, 2001
- Winkler SS, Spira J: Radiopacity of xenon under hyperbaric conditions. Am J Roentgenol Radium Ther Nucl Med 96:1035-1040, 1966
- Wintermark M, Thiran JP, Maeder P, et al: Simultaneous measurement of regional cerebral blood flow by perfusion CT and stable xenon CT: A validation study. AJNR Am J Neuroradiol 22:905-914, 2001